Emissions and environment
This page covers the company's greenhouse gas estimate and the other environmental topics in the IPD: air, noise, climate, wildlife, plants, parks and land use. Water and fish are on the water page.
In brief
Surge Copper estimates net greenhouse gas emissions of 5,838,389 tonnes of carbon dioxide equivalent (CO₂e) over construction and 28 years of operations, peaking at 270,957 tonnes in Year 5. Diesel burned by the mining fleet makes up most of it. The estimate leaves out land clearing, closure and post-closure, and a net-zero plan will be required because operations run past 2050. Air and noise baselines are at the desktop stage. The project overlaps a mountain goat winter range and sits at the western edge of the range of the Tweedsmuir caribou herd.
Greenhouse gases
The federal Strategic Assessment of Climate Change requires an early estimate in the IPD. Net emissions are direct emissions plus emissions from purchased energy, minus avoided domestic emissions and offsets. The company's estimate uses project information "as of July 2026" and will be updated. Source: IPD, p. 4-26.
| Component | Tonnes CO₂e | Basis |
|---|---|---|
| Direct: diesel and gasoline | 4,748,000 | Fuel for mining and mobile equipment; up to 83.7 million litres of diesel a year for mining equipment, in Year 5 Source: IPD, p. 4-27, Table 4.5-1; IPD, p. 4-28. |
| Direct: explosives | 193,809 | Emulsion explosives, up to 64,372 tonnes a year, in Year 5 Source: IPD, p. 4-28, Table 4.5-2; IPD, p. 4-29. |
| Direct total | 4,941,811 | As stated in the IPD Source: IPD, p. 4-27. |
| Purchased electricity | 896,578 | BC Hydro power at 22.8 tonnes CO₂e per gigawatt hour Source: IPD, p. 4-30. |
| Net total | 5,838,389 | No capture, storage or offsets are planned so far Source: IPD, p. 4-31. |
The two "Direct" sub-totals are our sums of the company's annual tables. They add to the stated direct total within 2 tonnes of rounding.
Net emissions by year
Annual net emissions in tonnes CO₂e. Lighter bars are the three construction years. Source: IPD, p. 4-32, Table 4.5-4.
Show the numbers
| Year | Net tonnes CO₂e |
|---|---|
| Y-3 | 127,668 |
| Y-2 | 176,166 |
| Y-1 | 208,480 |
| Y1 | 227,494 |
| Y2 | 220,764 |
| Y3 | 247,179 |
| Y4 | 268,166 |
| Y5 | 270,957 |
| Y6 | 235,929 |
| Y7 | 242,981 |
| Y8 | 230,277 |
| Y9 | 228,496 |
| Y10 | 213,518 |
| Y11 | 237,538 |
| Y12 | 249,947 |
| Y13 | 202,536 |
| Y14 | 148,569 |
| Y15 | 200,078 |
| Y16 | 244,761 |
| Y17 | 245,871 |
| Y18 | 139,756 |
| Y19 | 134,287 |
| Y20 | 127,898 |
| Y21 | 145,828 |
| Y22 | 148,184 |
| Y23 | 117,345 |
| Y24 | 141,482 |
| Y25 | 104,705 |
| Y26 | 141,286 |
| Y27 | 101,614 |
| Y28 | 108,627 |
What the estimate leaves out
- Land clearing. "At this stage of the Project, no data is available on the total area to be cleared", so land use emissions are excluded until the application. Source: IPD, p. 4-27; IPD, p. 4-31.
- Closure and post-closure. The current estimate covers all phases "except Closure and Post-Closure". Source: IPD, p. 4-26.
- Concentrate transport. The fuel tables cover mining and mobile equipment. Concentrate trucking, done by third parties outside Surge's "care and control", does not appear as a line in them. Source: IPD, p. 4-27, Table 4.5-1; IPD, p. 3-11.
The company's comparisons
The IPD compares the peak year with BC's 2030 target of 38,800,000 tonnes a year (0.70%) and with Canada's 2030 target of 511 megatonnes (0.05%). It concludes that the emissions "will have a negligible effect on the ability for BC and Canada to meet their GHG emissions targets". Table 10-1 adds that the project's carbon intensity, about 1.27 tonnes CO₂e per tonne of copper equivalent, "places it in the lowest global 10th percentile for open pit copper operations". The IPD cites no source for that ranking. Source: IPD, p. 4-33; IPD, p. 10-11.
Because operations are expected to run past 2050, the IPD states that a net-zero plan "will be required". The IPD quotes a provincial requirement that projects provide, during the assessment, "a credible plan for their Project to achieve net-zero greenhouse gas emissions by 2030, in the case of liquified natural gas facilities, or 2050 in the case of all other Projects". Source: IPD, p. 4-33.
Our assessment. Table 10-1 gives a different figure: "approximately 3,357 kt CO₂e over the 28-year operations phase (~111.5 kt CO₂e/yr)". The company's own annual table sums to about 5.33 million tonnes for Years 1 to 28, or about 190,000 tonnes a year. We assess that the section 4.5 tables, which reconcile with their stated totals, are the IPD's working estimate, and that the Table 10-1 figure is out of date. Source: IPD, p. 10-2; IPD, p. 4-32, Table 4.5-4.
Air
The IPD expects fugitive dust from blasting, haul roads, conveyors, crushers, stockpiles and the tailings beach. It also expects nitrogen oxides, carbon monoxide and particulate from blasting and diesel equipment, and minor emissions from concentrate handling. Dispersion modelling "will be required" during the assessment. Source: IPD, p. 4-34.
- Baseline. Air quality work so far is a 2026 desktop selection of stations for sulphur dioxide and carbon monoxide. Source: IPD, p. 8-1, Table 8-1.
- Inversions. From October 2016 to December 2017 there were 48 days when the Berg weather station, at 1,780 metres, was warmer than the Bergeland station, at 1,124 metres. On six days the difference exceeded 10°C, and the largest was 15°C on December 7, 2017. Source: IPD, p. 8-6.
- Where it could settle. Table 10-1 notes that in inversions and low wind "emissions may concentrate in valley bottoms". It names Nanika Lake, nearby provincial parks and traditional use areas as places dust may reach in high winds. Source: IPD, p. 10-2.
Noise and vibration
Noise sources include blasting, haul trucks, crushing, conveyors and the plant, running "24/7 over 28 years" according to Table 10-1. The company expects the main receptors to be wildlife, given the remote setting, and also considers cultural land use. No quantitative noise data exist yet. A baseline program is to record at least 72 consecutive hours at each site in summer and in winter. Source: IPD, p. 4-34; IPD, p. 10-2; IPD, p. 8-17; IPD, p. 8-18.
Climate
The company used 1981 to 2010 normals from the Kemano station in its water balance. They show 1,986.9 mm of precipitation a year, 58% of it from October to January, and monthly mean temperatures from -1.5°C in January to 16.5°C in July. At the Berg station itself, temperatures in 2016 and 2017 ranged from -26°C to 24°C. Source: IPD, p. 8-3; IPD, p. 8-4; IPD, p. 8-6.
Wildlife
Species confirmed in the area include grizzly bear, black bear, moose, marmot, mountain goat and wolverine. A two-year wildlife baseline is planned. Source: IPD, p. 8-20.
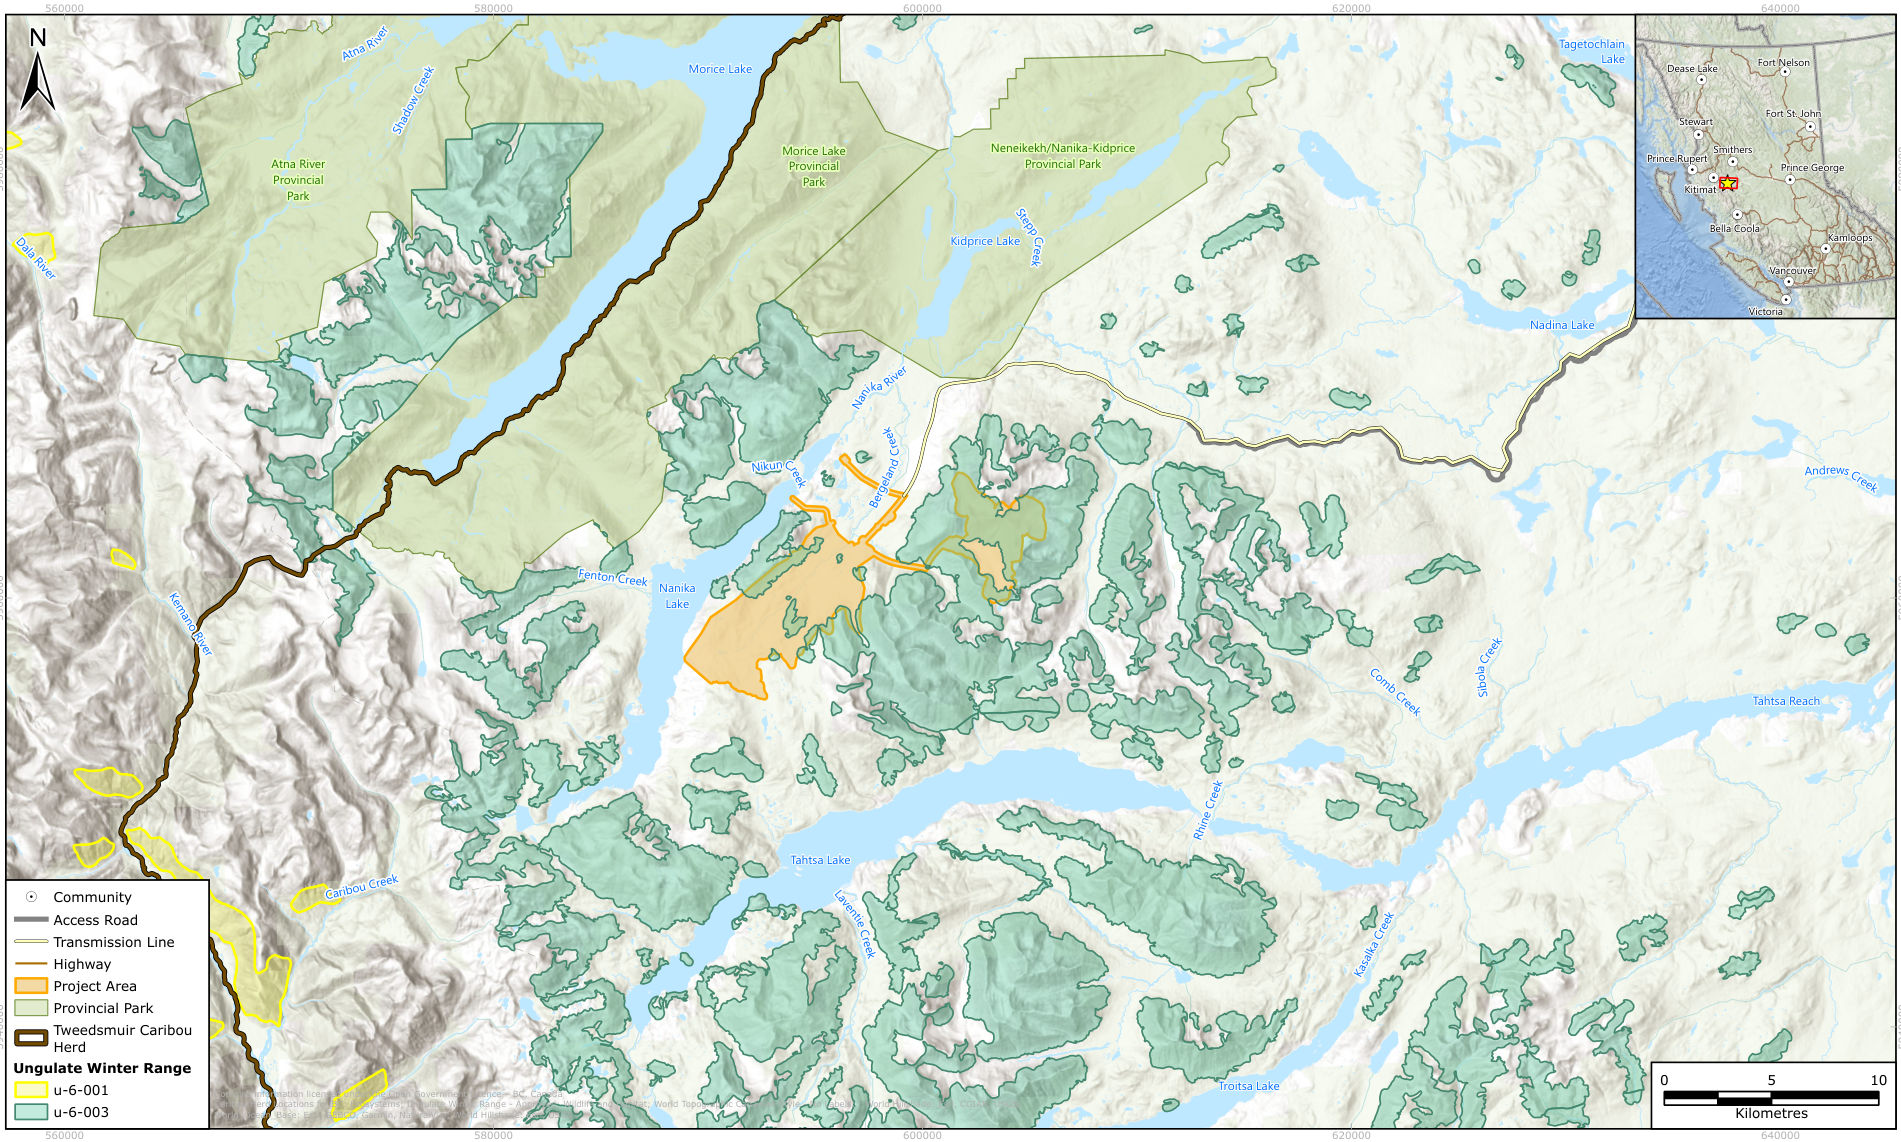
- Caribou. The project lies at the western edge of the local population unit of the Tweedsmuir caribou herd. Section 8.1.11 states that the Tweedsmuir-Entiako herd "is listed as threatened on Schedule 1" of the federal Species at Risk Act. Habitat suitability modelling is under way, with field validation to follow. Source: IPD, p. 8-20; IPD, p. 8-3, Table 8-1; IPD, p. 8-22.
- Mountain goat. The resource area and open pit fall partly within mountain goat ungulate winter range U-6-003. Source: IPD, p. 8-20.
- Other listed species. Table 8.1-5 lists amphibians, birds and mammals that may occur, among them American goshawk (laingi subspecies), wolverine, grizzly bear and three bat species. Source: IPD, p. 8-22; IPD, p. 8-23.
- Restoration. Surge proposes early talks with Cheslatta Carrier Nation and the Wet'suwet'en on restoration under the 2020 Tactical Restoration Plan for the Tweedsmuir-Entiako caribou herd. In July 2026 it met federal officials about offsets for impacts on caribou. Source: IPD, p. 6-14; IPD, p. 7-9.
The IPD lists the caribou differently in two places. Section 8.1.11 and Table 10-1 give the herd as federally threatened. Table 8.1-5 gives caribou (southern mountain population) as special concern under the Species at Risk Act. Source: IPD, p. 8-20; IPD, p. 10-6; IPD, p. 8-23, Table 8.1-5.
Plants and ecosystems
Three biogeoclimatic units cover the area: alpine tundra, Engelmann spruce and subalpine fir forest, and mountain hemlock forest. A database search found 15 listed plants, mosses and lichens with potential to occur, by our count of Table 8.1-4. Whitebark pine, described as "a SARA-listed Endangered species", is "known to occur in high-elevation areas of the Project". Field surveys and ecosystem mapping began in 2026. Source: IPD, p. 8-18; IPD, p. 8-19; IPD, p. 10-5; IPD, p. 8-2, Table 8-1.
Table 10-1 gives approximate footprints for the main disturbances: about 1,165 hectares for the TWMF, 400 hectares for the open pit, 180 hectares for waste rock dumps and 20 hectares for the process plant. Source: IPD, p. 10-3.
Parks, recreation and land use
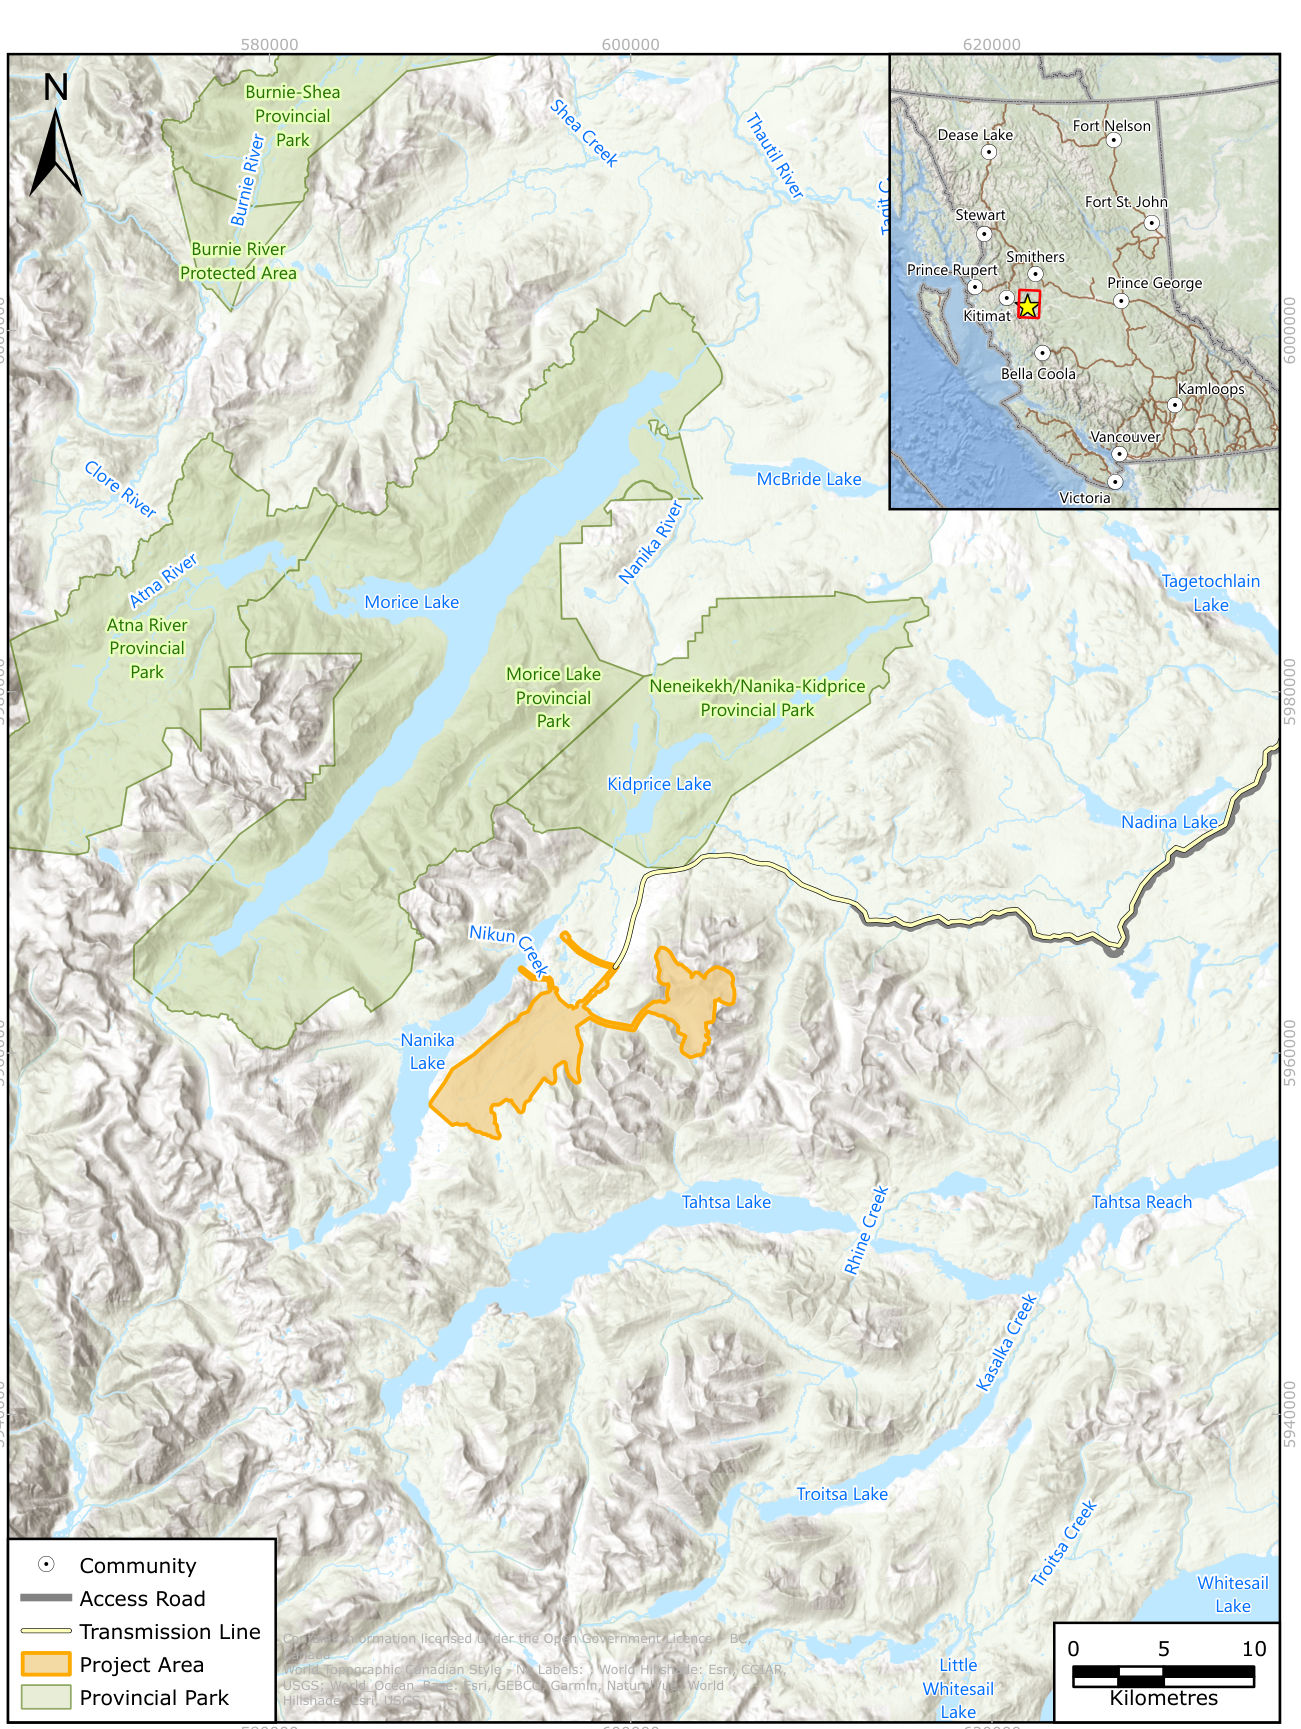
The Project Area is about 4 km from Nenikëkh/Nanika-Kidprice Provincial Park and about 5 km from Morice Lake Provincial Park. Atna River Provincial Park is about 21 km away. The Kidprice Lake chain, a protected area under the Morice Land and Resource Management Plan, is about 10 km from the resource area. Source: IPD, p. 3-8; IPD, p. 9-2.
- The Nanika Lake Trail is about 1 km from the project, and the Sibola Rhineridge Cabin about 2 km. Source: IPD, p. 3-10, Table 3.2-3.
- A known canoe route ends at Kidprice Lake, and the Burns Lake Snowmobile Club runs a cabin near the bottom of the current access road. Source: IPD, p. 9-2.
- Two guide outfitter areas and two trapline areas overlap the Project Area. Table 9.2-1 numbers the traplines TR0609T021 and TR0609T018; Table 10-1 names traplines TR 726 T005 and TR 726 T006. Source: IPD, p. 9-2; IPD, p. 9-3, Table 9.2-1; IPD, p. 10-8.
- An obsidian arrowhead found on a ridgeline at about 1,800 metres in August 2016 is the only recorded archaeological find. An archaeological overview and impact assessment are expected. Source: IPD, p. 9-10.
Where the baseline stands
| Discipline | Years active |
|---|---|
| Hydrology | 2007 to 2008, 2011 to 2012, limited 2014 to 2017, 2024 |
| Meteorology and climate | 2007 to 2009, 2011, 2013 to 2017, 2024 to 2026 |
| Surface water quality | 1988, 2007 to 2011, 2013 to 2017, 2024, 2026 |
| Fish and fish habitat | 1988, 2007, 2024 to 2025, 2026 |
| Geochemistry | 2007, 2024 to 2026 |
| Groundwater | 2024, 2026 |
| Wildlife | Incidental observations, 2025, 2026 |
| Soils and vegetation | 2026 |
| Air quality, noise, visual resources, archaeology | 2026 (desktop) |
Source: IPD, p. 8-1, Table 8-1; IPD, p. 8-2; IPD, p. 8-3.
Our assessment. We assess that the physical baseline for water and climate is long but intermittent, and the biological and human-environment baselines are just beginning. Air, noise, visual and archaeological work has not left the desktop, so most effects in Table 10-1 are stated as possibilities rather than predictions.
Sources
- Surge Copper, Initial Project Description and Engagement Plan, September 2026: section 4.5, chapters 8 and 9, and chapter 10
Page references give the printed page label; each link opens the PDF at that page.