Water
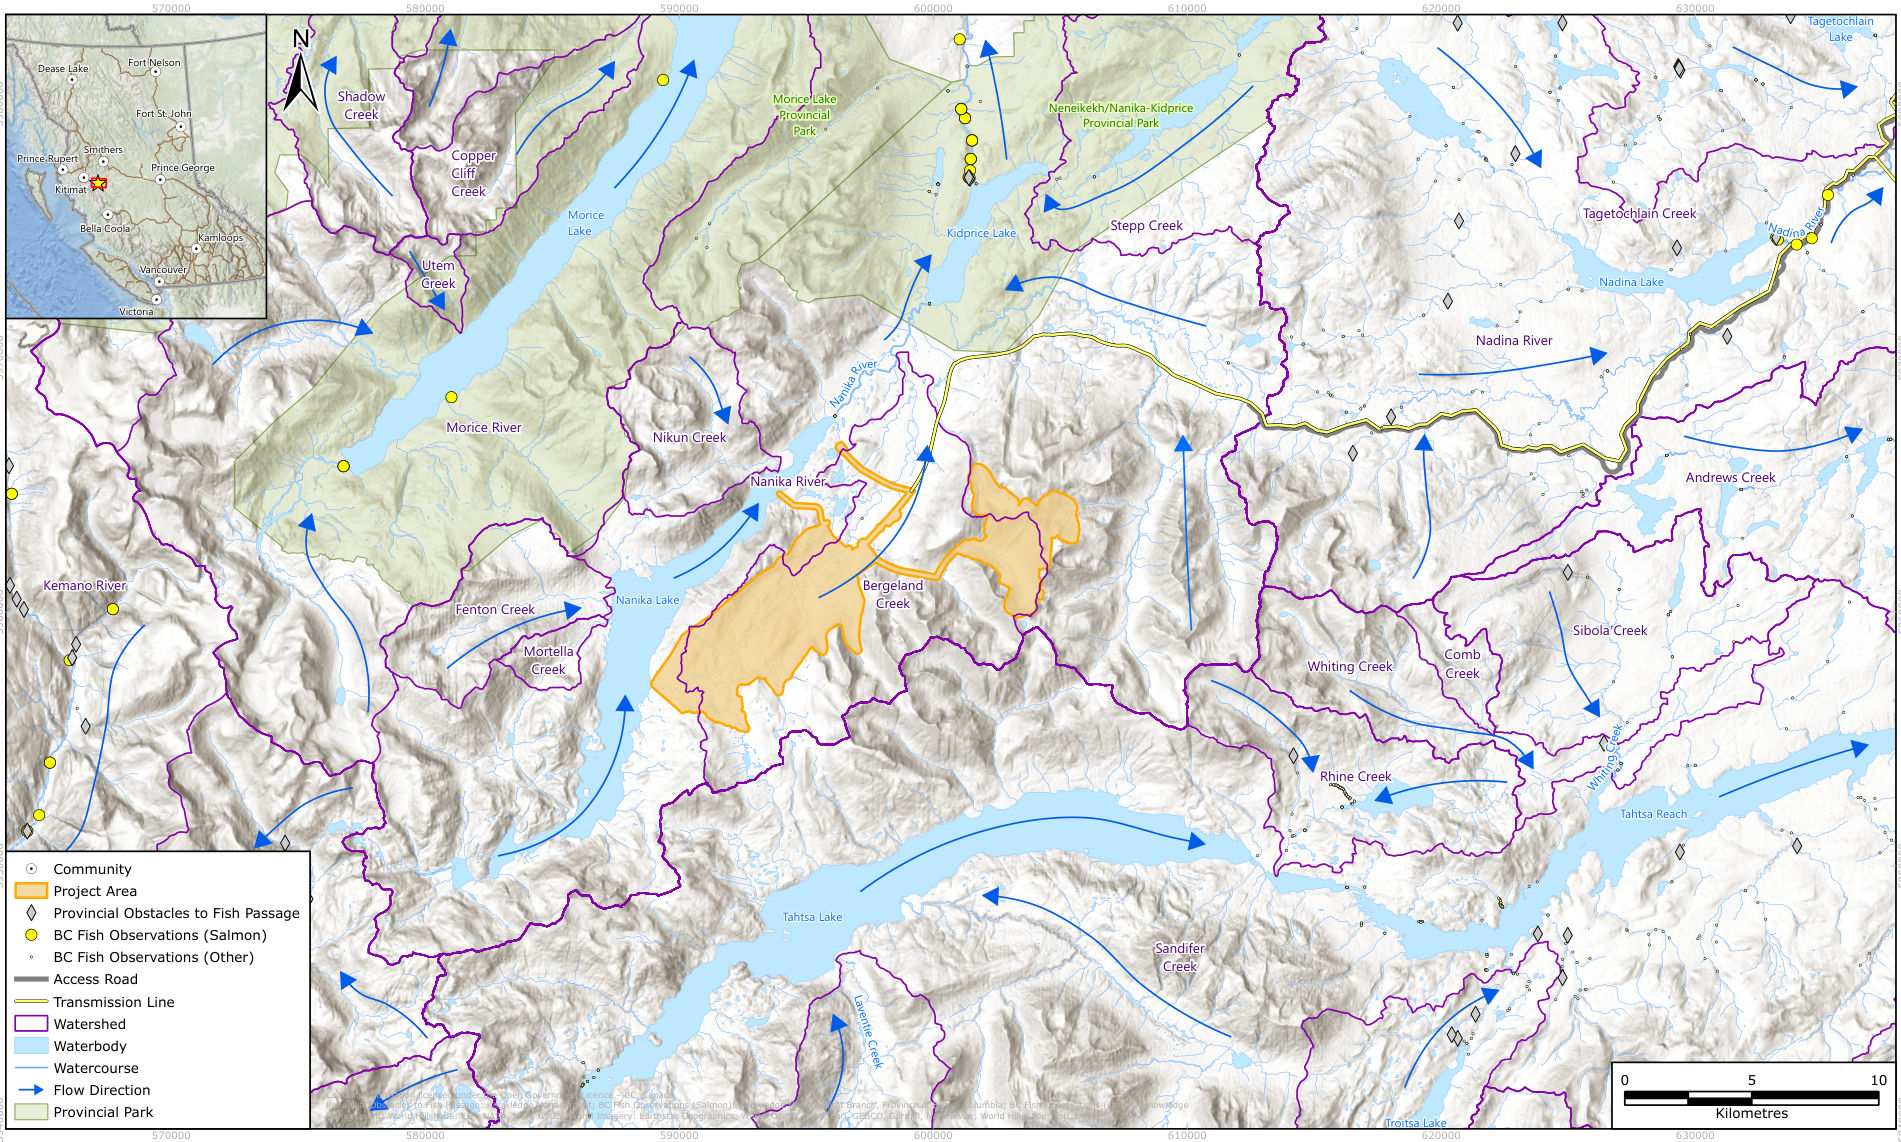
Berg sits in the upper Nanika River watershed, which drains to the Morice and Skeena salmon rivers. This page sets out where the mine's water comes from, how much surplus it expects, what the company says about treatment and discharge, and which creeks and lakes are involved.
In brief
The company's preliminary water balance shows the site collecting more water than the mill uses: a net surplus of 1,210 cubic metres an hour on average, with deficits only from May to August. Surge therefore expects to release treated water and to need active water treatment, but it has not yet chosen the treatment method or the discharge location. Fresh make-up water is to come from Nanika Lake. The site drains through Berg and Bergeland creeks and the Ney River to the Nanika River, then to the Morice, Bulkley and Skeena rivers.
The watershed
The project lies in the upper Nanika River watershed, part of the Morice River drainage. Its infrastructure is planned within the Bergeland Creek and Ney River watersheds. Runoff drains north to the Nanika River, then the Morice, Bulkley and Skeena rivers, and on to the Pacific. The deposit itself sits above Berg Creek, which feeds Bergeland Creek. Source: IPD, p. 8-8; IPD, p. 8-12; IPD, p. 3-10.
The IPD describes the Morice as "one of the most productive salmon rivers in northern BC" and as "a Class I designated watershed in BC". It lists Chinook, coho and sockeye salmon and steelhead trout in the lower Morice system. It also notes that the Skeena salmon system falls under the Pacific Salmon Treaty with the United States. Source: IPD, p. 10-4; IPD, p. 10-5; IPD, p. 10-12.
The water balance
The PFS includes a "high-level plan for water management, including a conceptual water balance". It counts runoff from the pit, plant and camp, evaporation from the pond, and the plant's water demand. The company adds that groundwater and pit dewatering values will be refined during the assessment. Source: IPD, p. 4-14; IPD, p. 4-16.
| Average condition | m³/h | m³ a year |
|---|---|---|
| Precipitation on pits and surrounding area | 1,284 | 11,257,582 |
| Contact water from waste rock storage facilities | 769 | 6,742,292 |
| Contact water from mine infrastructure and crusher area | 591 | 5,184,478 |
| Pit dewatering (base case) | 292 | 2,555,000 |
| Contact water from process plant area | 23 | 203,435 |
| Contact water from camp area | 5 | 44,462 |
| Less: process plant make-up water demand | 1,754 | 15,365,040 |
| Surplus | 1,210 | 10,622,209 |
Source: IPD, p. 4-17, Table 4.1-2. The rows are the company's; we have reordered them by size.
| Month | Jan | Feb | Mar | Apr | May | Jun | Jul | Aug | Sep | Oct | Nov | Dec |
|---|---|---|---|---|---|---|---|---|---|---|---|---|
| Surplus (m³/h) | 1,661 | 1,016 | 2,335 | 233 | -342 | -409 | -453 | -208 | 1,286 | 3,751 | 3,511 | 2,144 |
Source: IPD, p. 4-17, Table 4.1-2. Negative values (red) are months when the plant needs more water than the site collects. The largest surpluses fall in October and November, the wettest months in the Kemano climate normals the company used. Source: IPD, p. 8-4, Table 8.1-1.
From this balance the company concludes that "the Project will require release of treated water into the natural environment. The location, quality and quantity of this water release will be detailed for inclusion in the EA." Source: IPD, p. 4-16.
Table 10-1 of the same IPD gives "an anticipated annual water surplus of approximately 365 m³/hr under average conditions", less than a third of the figure in Table 4.1-2 by our arithmetic. Source: IPD, p. 10-4; IPD, p. 4-17, Table 4.1-2.
Water supply
Fresh make-up water "is currently assumed to be sourced from Nanika Lake", pumped through about 4,200 metres of overland pipeline to tanks at the process plant. Groundwater is under study as an alternative, although the company states a preference for surface water. Water reclaimed from the TWMF goes back to the mill for flotation, to reduce demand and discharge. Source: IPD, p. 4-16; IPD, p. 4-20, Table 4.2-1; IPD, p. 4-35.
- No active water licences fall within the Project Area; the nearest is 17.2 km to the east. Source: IPD, p. 9-2.
- Nee Tahi Buhn Indian Band asked for a robust understanding of water use, water movement and volume "as droughts within the area impact water availability for processing/plant operations". Source: IPD, p. 6-27, Table 6.10-2.
- Table 10-1 gives the pipeline as about 4,565 metres, against 4,200 metres in section 4.1.5.1. Source: IPD, p. 10-3; IPD, p. 4-16.
Managing water on site
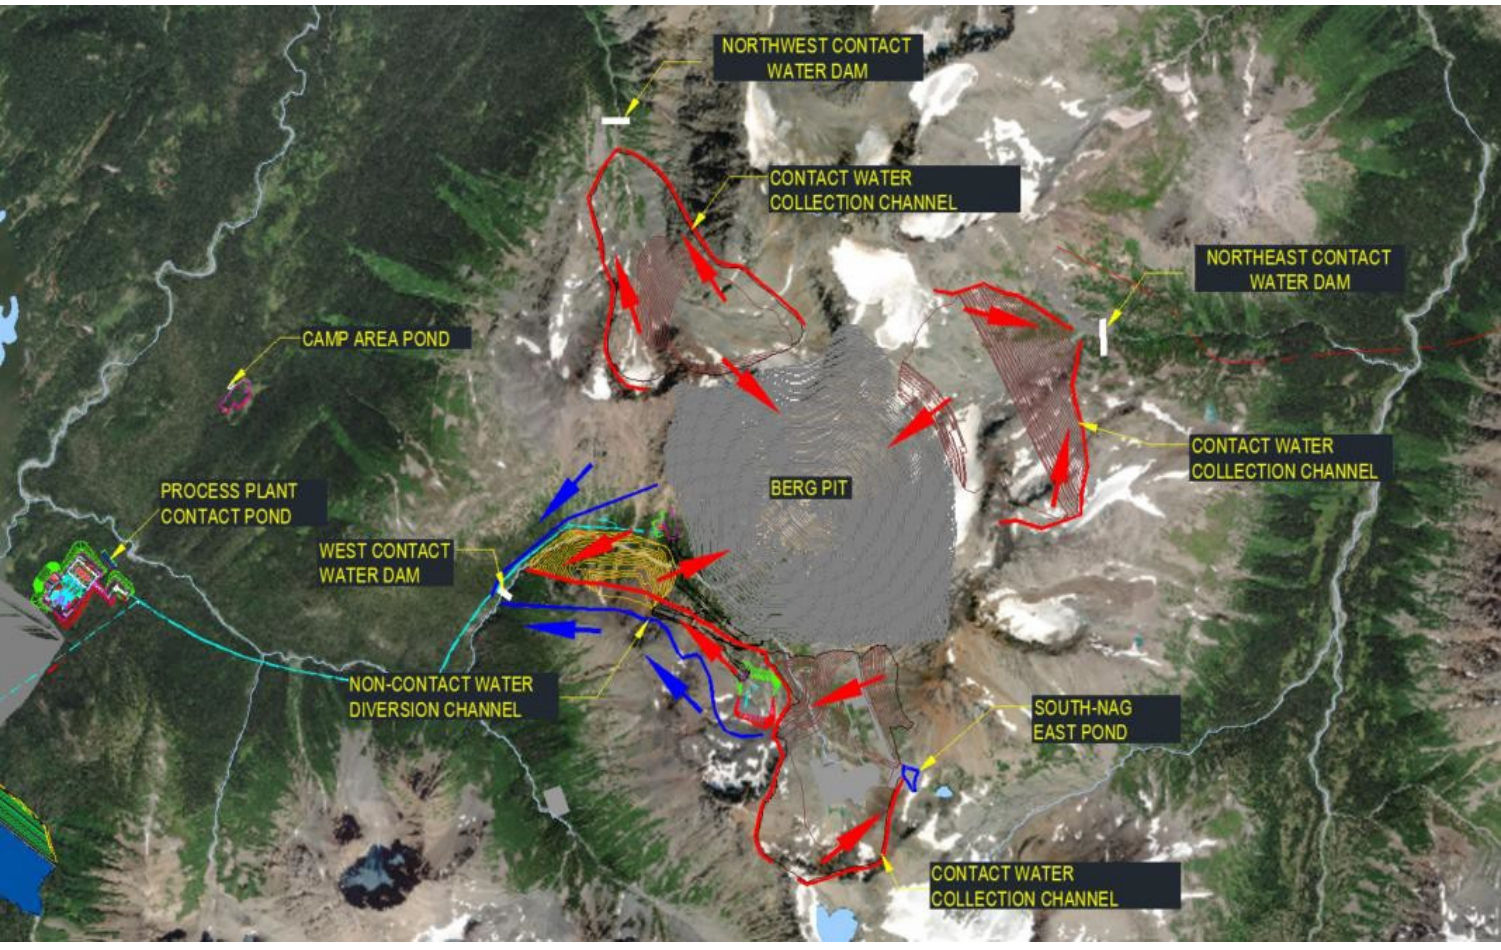
The company plans to collect runoff that touches mine workings ("contact water") and to send clean runoff around the site. Source: IPD, p. 4-14.
- Collection channels carry runoff from disturbed ground to ponds or dams, by gravity where possible. Source: IPD, p. 4-14.
- Collection ponds at low points hold the runoff from a 1-in-100-year, 24-hour storm with at least 0.5 metres of freeboard. Source: IPD, p. 4-14.
- Collection dams serve where steep terrain rules out ponds; Figure 4.1-5 shows northwest, northeast and west contact water dams around the pit. Source: IPD, p. 4-14; IPD, p. 4-15, Figure 4.1-5.
- Diversion channels upslope of the TWMF, pit and stockpiles carry clean water around the site, about 2,527 metres in total according to Table 10-1. Source: IPD, p. 4-14; IPD, p. 10-4.
Treatment and discharge
The IPD states: "Active water treatment facilities are expected to be required to ensure water quality will meet standards prior to release." Any treatment proposed in the application is to reach Technology Readiness Level 7, and 8 or 9 before permits are approved. Figure 4.1-1 places a water treatment plant beside the process plant. Source: IPD, p. 4-16; IPD, p. 4-3, Figure 4.1-1.
For water treatment technologies and the discharge location, Table 4.7-1 records: "No preferred alternative has been selected as ongoing studies and design work continue to inform optimization of configurations. It is assumed that water treatment will meet applicable standards or guidelines for release." Source: IPD, p. 4-38, Table 4.7-1.
At closure, water treatment continues until water in the TWMF meets discharge criteria; the facility then discharges passively through a closure spillway. Source: IPD, p. 4-23.
What the discharge could carry
Table 10-1 lists total suspended solids, metals (copper, molybdenum, selenium, zinc, arsenic), low-pH water and nutrients among the contaminants that treated contact water could introduce. It singles out two:
- Molybdenum. The IPD gives the BC guideline for aquatic life as 0.073 mg/L and states that "effective treatment to meet this guideline in high-volume water discharges is technically challenging". Source: IPD, p. 10-4.
- Selenium. The IPD calls selenium leaching "a characteristic concern for porphyry copper deposits" and notes that selenium accumulates in the food web. Source: IPD, p. 10-4.
Our assessment. We assess that the IPD has identified the hard problem without yet proposing a solution. It expects a year-round surplus, names molybdenum treatment at high volume as "technically challenging", and has not chosen a treatment method or a receiving water. These choices, and the water quality predictions behind them, will shape the rest of the review.
The water today
Baseline sampling began in 2007. Water draining the deposit, especially in Berg Creek, naturally carries elevated dissolved solids, sulphate, hardness and metals. Some locations exceed guidelines for aluminum, cadmium, copper, iron, lead and zinc. Quality improves downstream with dilution; the Ney River and reference creeks represent regional background. Waters are generally well oxygenated and near neutral pH. Source: IPD, p. 8-16; IPD, p. 8-17.
- Surface water. Eleven streams were sampled from 2007 to 2011, three core sites from 2013 to 2017, and ten locations in 2024. In 2026 the network grew to 21 sites with monthly sampling, including Nanika and Kidprice lakes, and both lakes were surveyed for depth and water column. Source: IPD, p. 8-2, Table 8-1.
- Stream flow. Flow was monitored at 17 locations between 2007 and 2017, intermittently. The company reports "difficult hydrometric monitoring conditions", with significant river avulsions since 2007. Source: IPD, p. 8-13.
- Groundwater. The 2026 network includes more than 25 monitoring wells. Investigations found artesian conditions at several locations. Overburden in the mine area ranges from bare rock to about 80 metres and averages about 10 metres. Pit dewatering will lower the local water table. Source: IPD, p. 8-2, Table 8-1; IPD, p. 8-16; IPD, p. 8-15; IPD, p. 10-3.
Fish
Dolly Varden are the main fish in the Bergeland Creek watershed, found throughout accessible reaches. Rainbow trout live in connected lakes and lower-gradient reaches, and lake trout, lake chub and longnose sucker in some lakes and outlets. Waterfalls and steep channels leave many headwaters naturally fishless. No listed aquatic species at risk have been documented so far. Source: IPD, p. 8-8; IPD, p. 8-9; IPD, p. 8-10.
Work is under way "to confirm salmonid species absence" in Nanika Lake, Kidprice Lake and small lakes in the Bergeland Creek area. Office of the Wet'suwet'en technicians questioned the baseline design. They asked for more environmental DNA (eDNA) sites and for added sampling at Nanika Falls, which they do not consider a fish barrier. Source: IPD, p. 8-9; IPD, p. 6-15, Table 6.6-2.
Creeks and lakes named in the IPD
| Water | Role in the plan |
|---|---|
| Berg Creek | Drains the deposit; highest natural metal concentrations. Source: IPD, p. 3-10; IPD, p. 8-16. |
| Bergeland Creek | Receives Berg Creek; infrastructure watershed; Dolly Varden habitat; the Bergeland weather station sits near the proposed tailings area. Source: IPD, p. 8-12; IPD, p. 8-8; IPD, p. 8-6. |
| Ney River | Infrastructure watershed; reference water quality; the access road avoids its upper portions. Source: IPD, p. 8-12; IPD, p. 8-17; IPD, p. 4-18. |
| Nanika Lake | Proposed freshwater source; beside the TWMF; monthly sampling since 2026; Table 10-1 names it as a place mine dust may reach. Source: IPD, p. 4-16; IPD, p. 4-3, Figure 4.1-1; IPD, p. 8-2; IPD, p. 10-2. |
| Kidprice Lake | Monitored since 2026; a known canoe route ends there; the Kidprice Lake chain is a protected area about 10 km from the resource area. Source: IPD, p. 8-2; IPD, p. 9-2. |
| Nanika, Morice, Bulkley and Skeena rivers | Downstream receiving system; important rainbow trout spawning habitat in the Nanika River system below the Project Area. Source: IPD, p. 8-12; IPD, p. 8-9. |
What the Nations said about water
- Office of the Wet'suwet'en: "Maintaining the health of the Morice River Watershed is important for the well-being of salmon and Wet'suwet'en members." At an All-Chiefs meeting in April 2026, Hereditary Chiefs asked Surge to keep "water and salmon forefront". Source: IPD, p. 6-15, Table 6.6-2; IPD, p. 6-10.
- Witset First Nation: water resources surfaced as a key interest in tailings discussions. Source: IPD, p. 6-17.
- Nee Tahi Buhn: fisheries, water quality, water quantity and water management are its key interests. Source: IPD, p. 6-34, Table 6.12-1.
- Cheslatta Carrier Nation: fish and fish habitat are "of particular concern", in light of the long-term effects of damming the Nechako River. Source: IPD, p. 6-30.
Sources
- Surge Copper, Initial Project Description and Engagement Plan, September 2026: sections 4.1.5, 4.1.6, 4.5.4, 8.1.2 to 8.1.6, chapter 6 and Table 10-1
Page references give the printed page label; each link opens the PDF at that page.