What this shows
This is a 3D model of the proposed Berg Copper mine on present ground. It shows the open pit at its final (ultimate) design, the three waste rock dumps, the tailings facility with its two embankments and pond, and the outlines of the plant, roads, conveyor and pipelines. Each surface comes from a page of the company's filings. The ground comes from Natural Resources Canada's public elevation model.
Drag to move the ground, and drag with the right button (or hold Ctrl or Shift) to tilt and rotate. Scroll or pinch to zoom toward the pointer, and double-click or double-tap to zoom in. On a touch screen, two fingers moving up or down tilt, and a twist rotates. From the keyboard, focus the view and use ← → to rotate, ↑ ↓ to tilt, + − to zoom and W A S D to move. Switch on Present ground to see today's land laid over the design. It shows how deep the pit reaches and how high the dumps stand.
Mine shape in the record
These pages of the record fix the mine's shape in three dimensions. Each extract is an image of a page as Surge Copper filed it, with a note of what it adds to the model above; Show in 3D turns the view to that part.
What the record gives
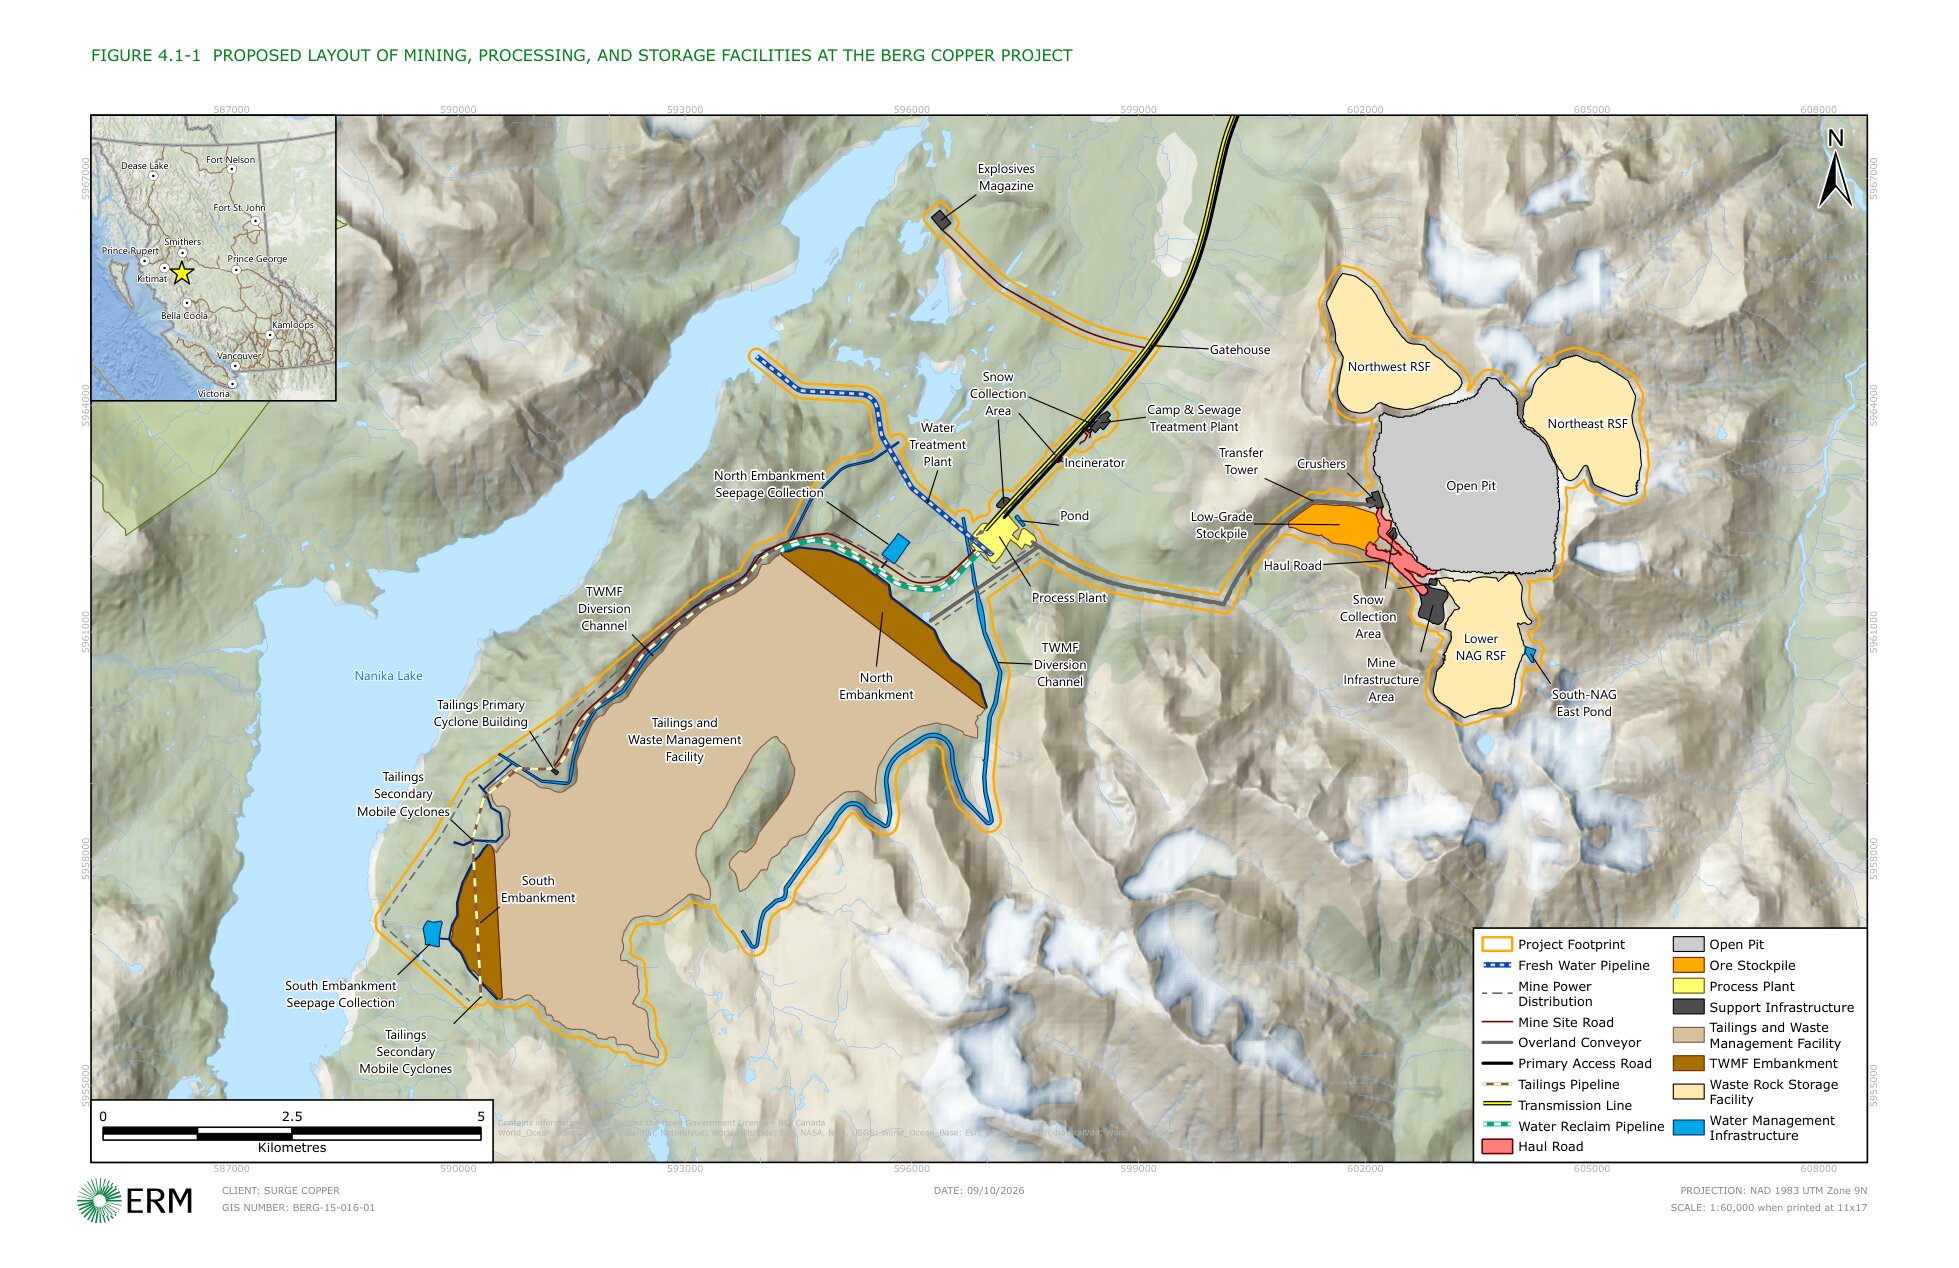
Two company documents carry the geometry. Its Initial Project Description (IPD) outlines every facility on a map grid but gives no heights. Its Pre-Feasibility Study (PFS) gives heights: pit benches and floors, crests of waste rock dumps and tailings embankments, and slopes between them. Both use one map grid (NAD 1983 UTM Zone 9N), so their drawings lay on each other. Source: IPD, p. 4-3, Figure 4.1-1; PFS, p. 223, Figure 16-13.
Where the mine sits
The IPD places the deposit's centre at 5,962,920 m north and 603,450 m east on its UTM grid. This point ties the model to the ground. Source: IPD, p. 3-5, Table 3.2-1.

Outline of every facility
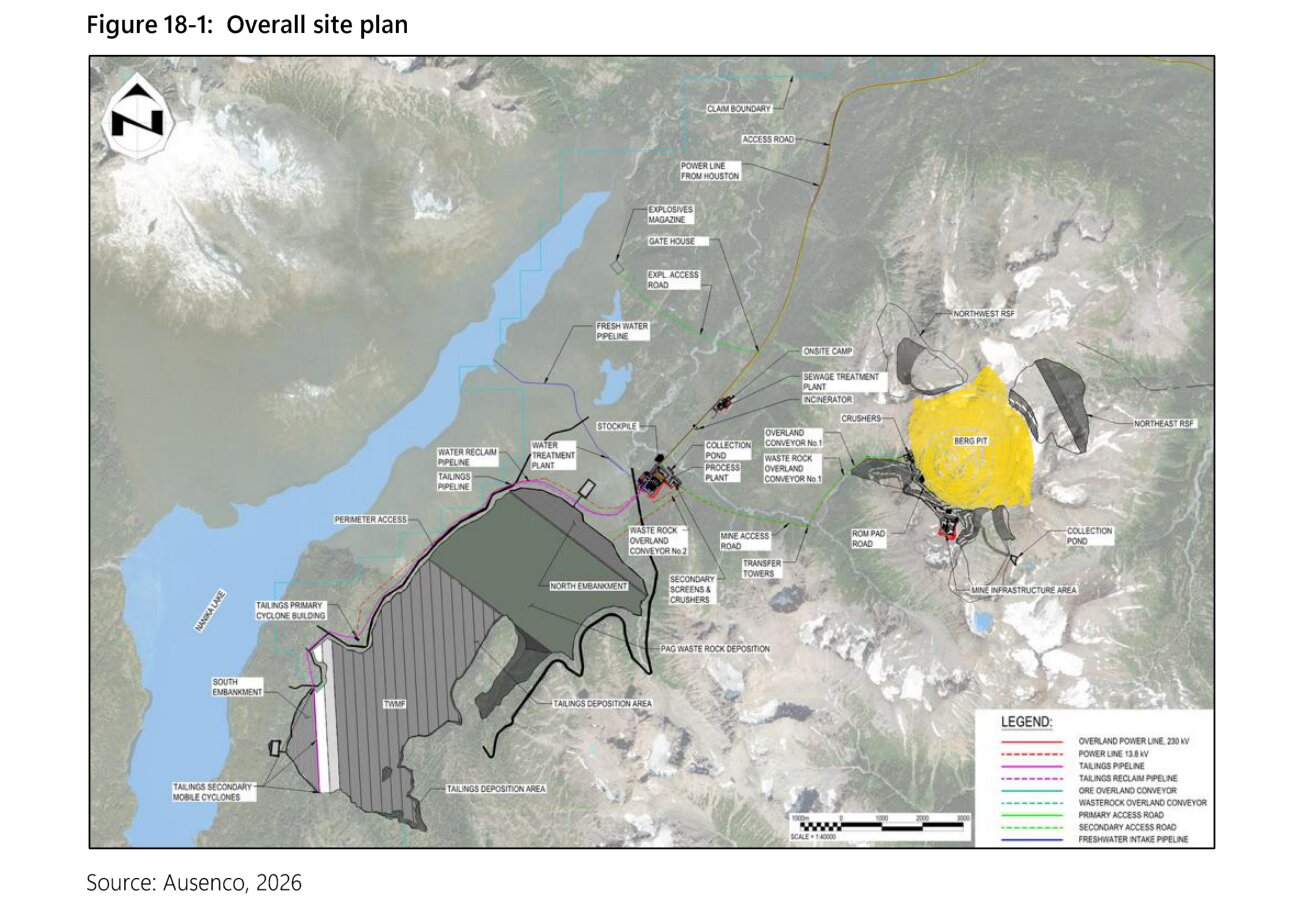
IPD Figure 4.1-1 is a GIS export with grid labels along its edges. This site's project map already traces its 40 footprints: pit (472 hectares), three waste rock dumps, tailings facility and its two embankments, plant, conveyor, roads and pipelines. The model takes these outlines as each facility's plan. Source: IPD, p. 4-3, Figure 4.1-1.
Pit, phase by phase
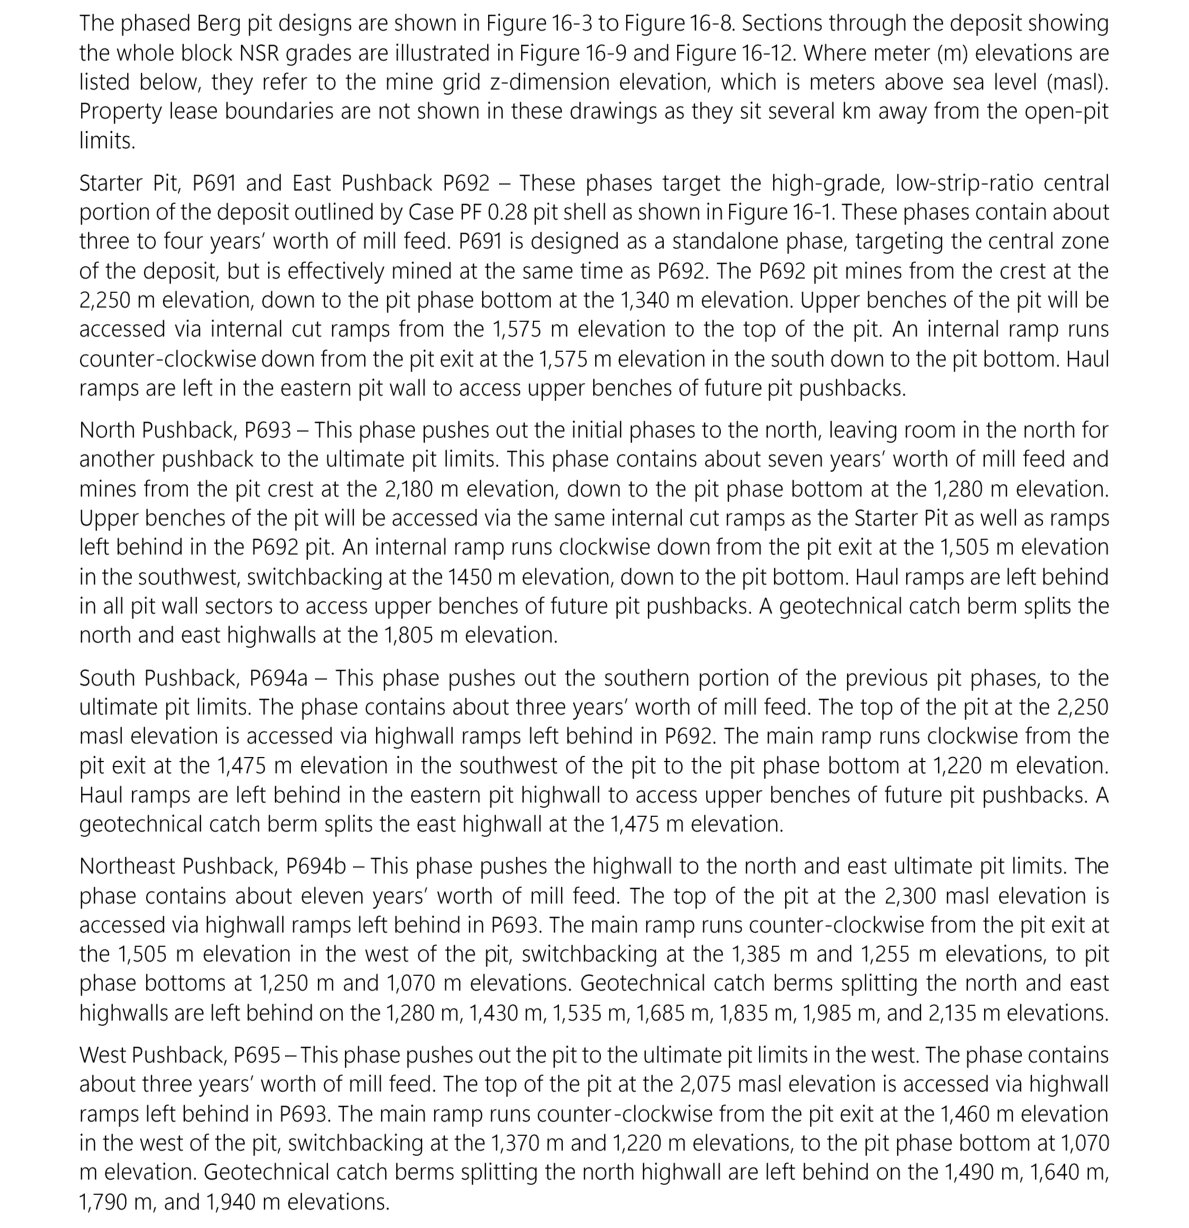
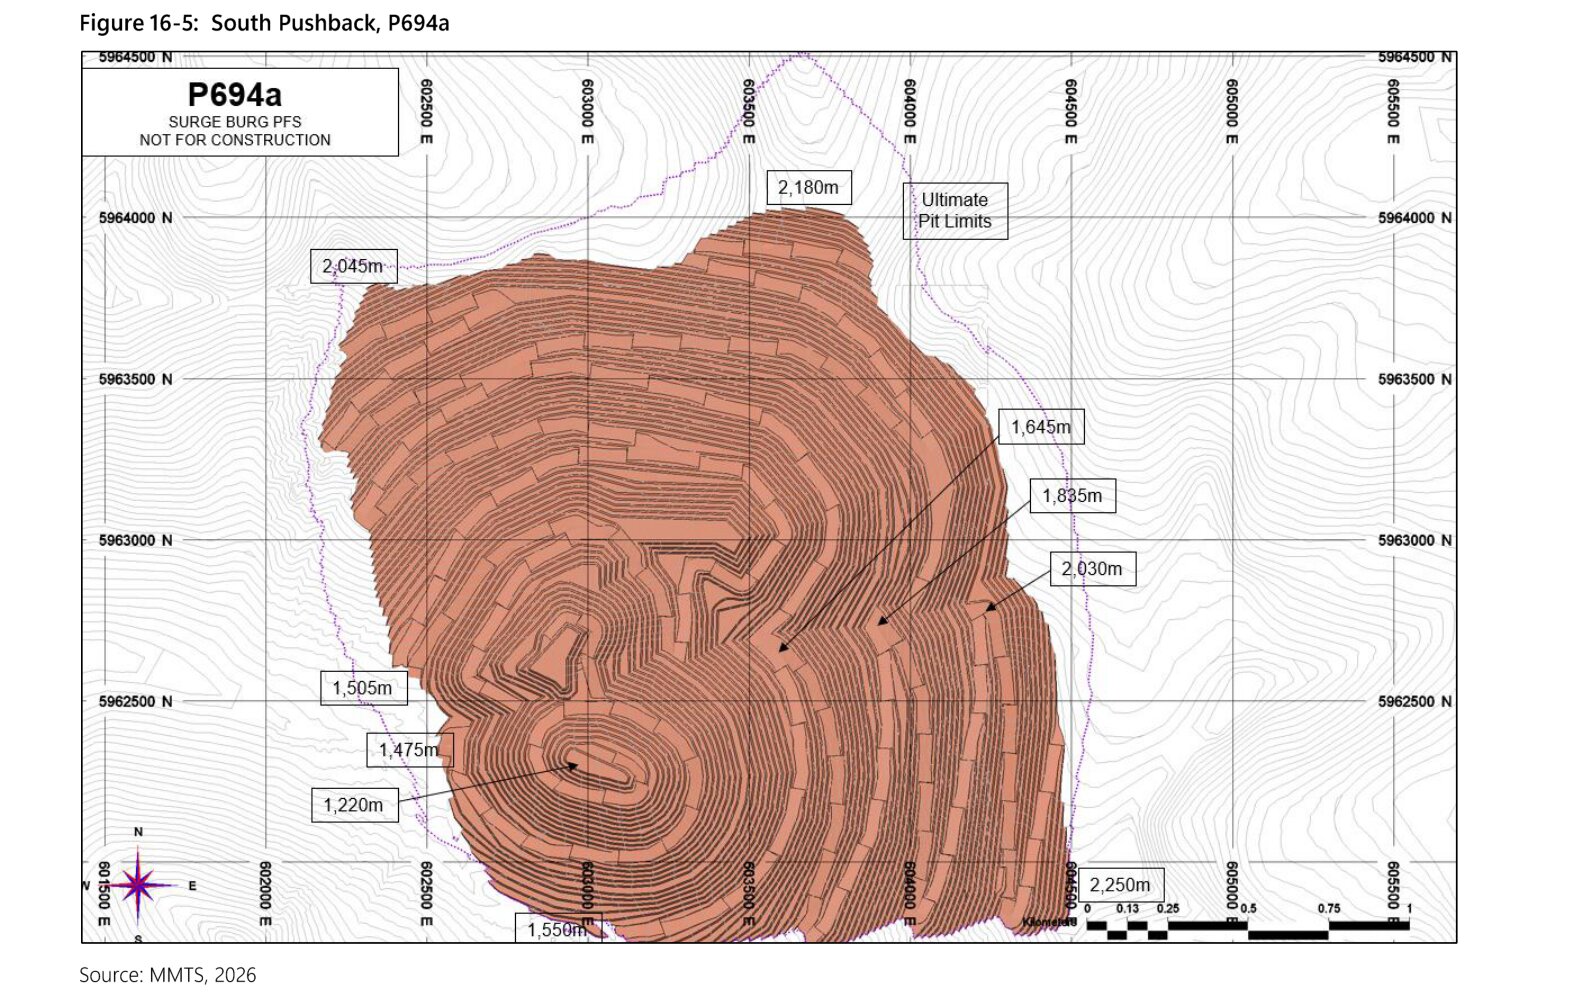
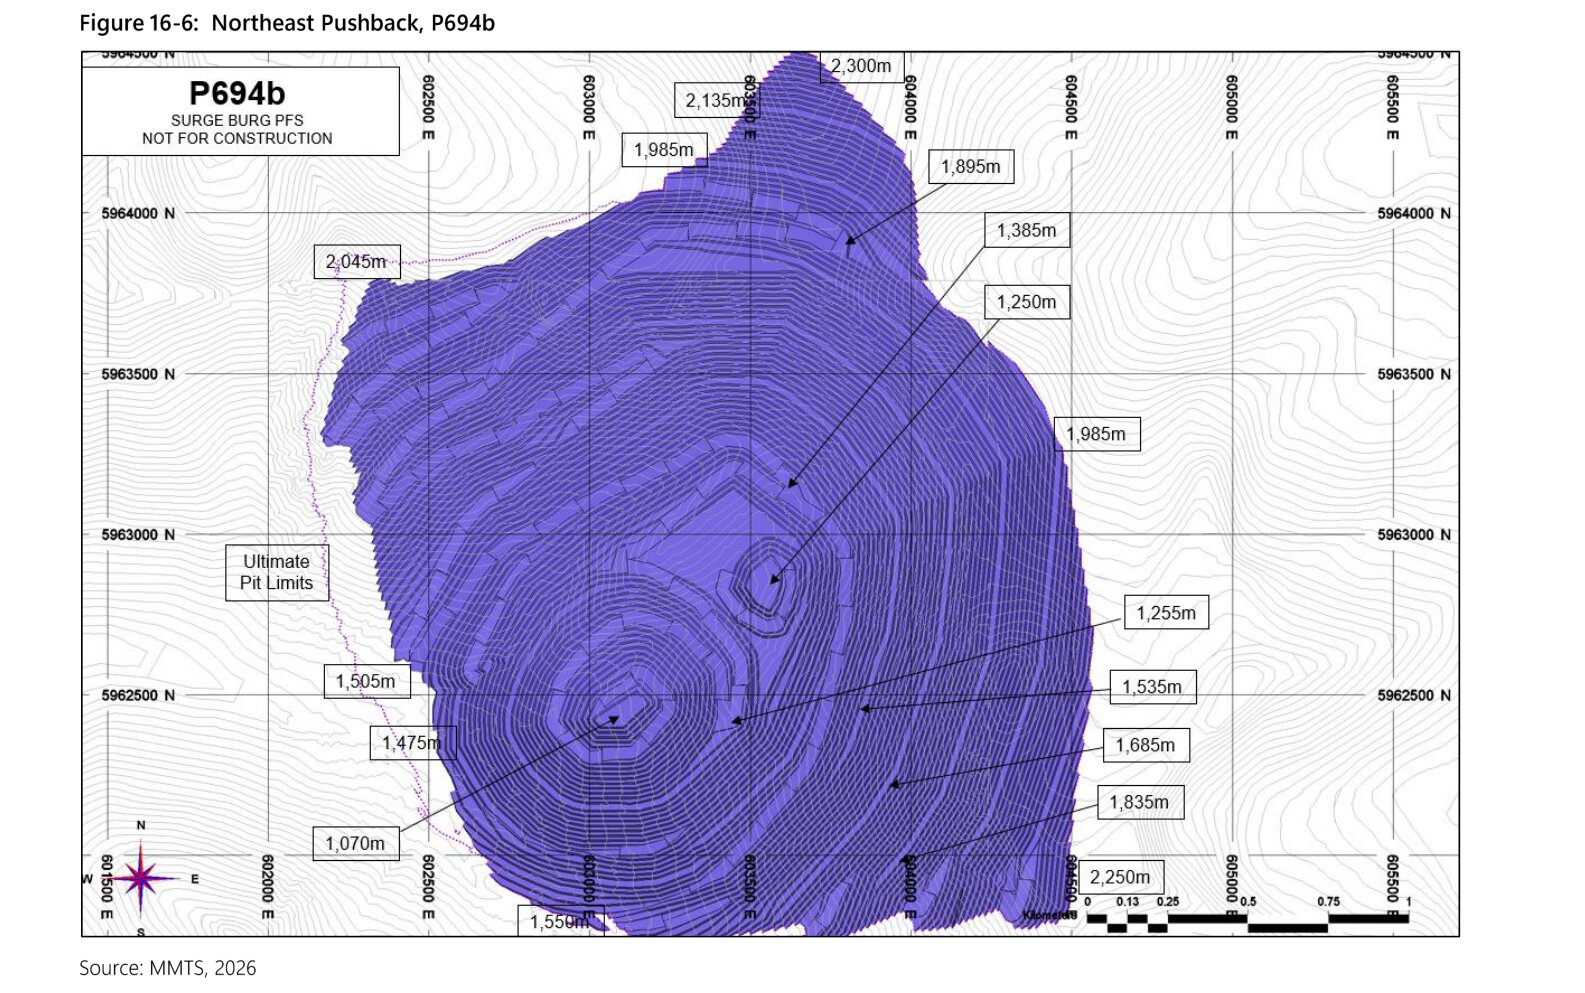
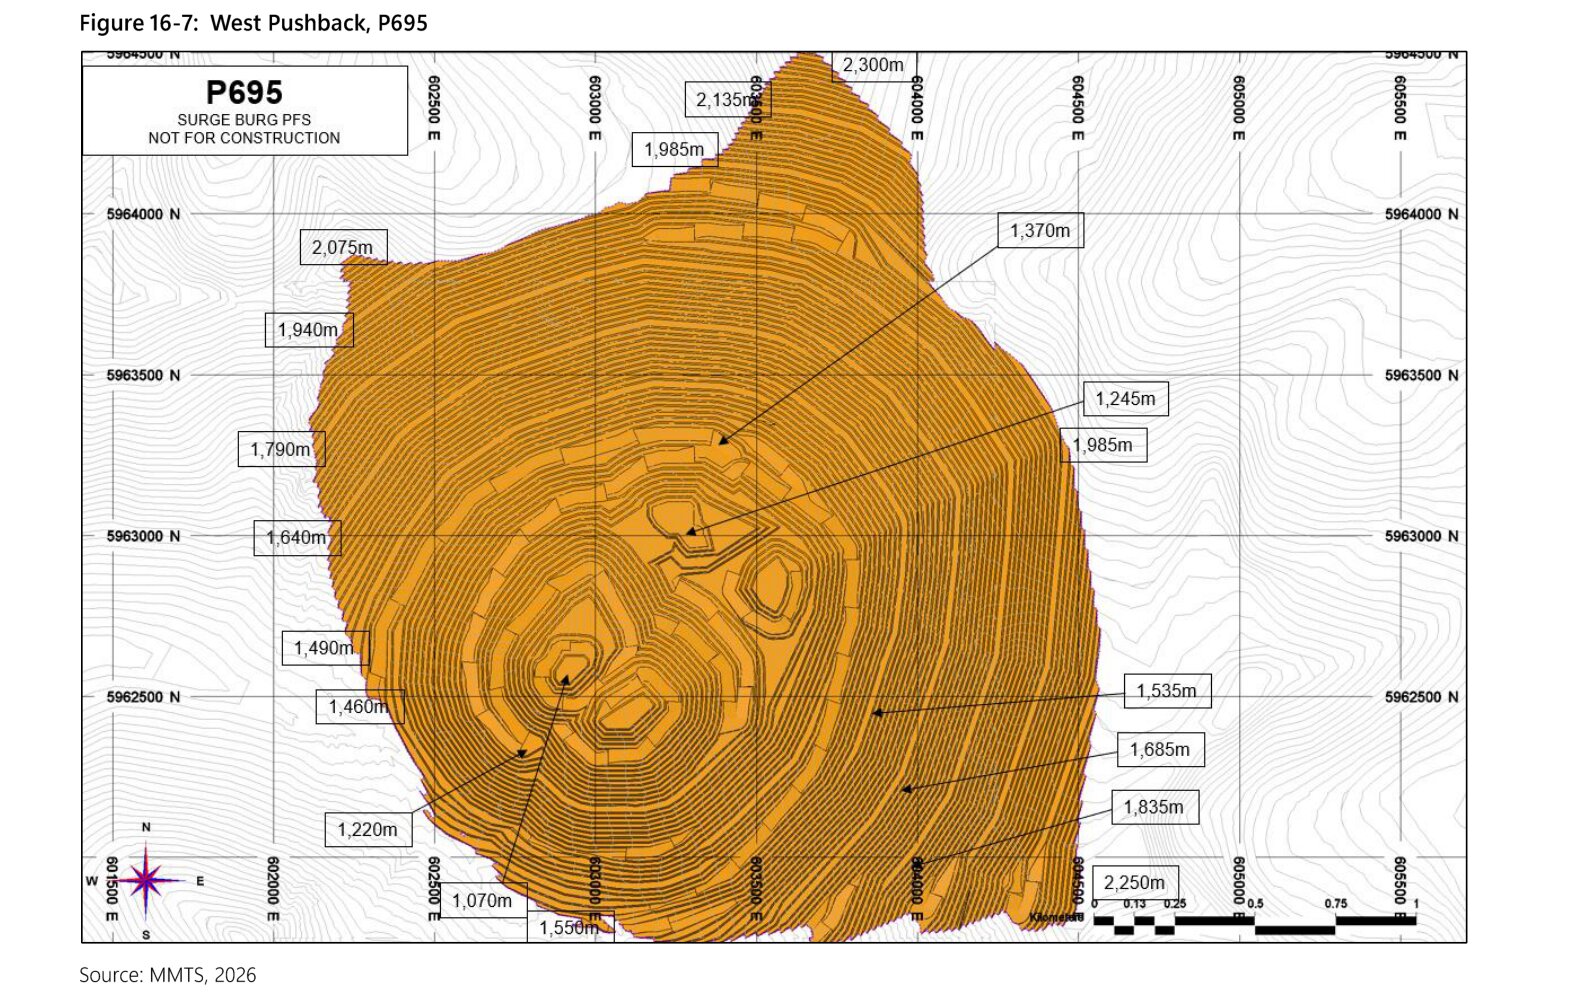
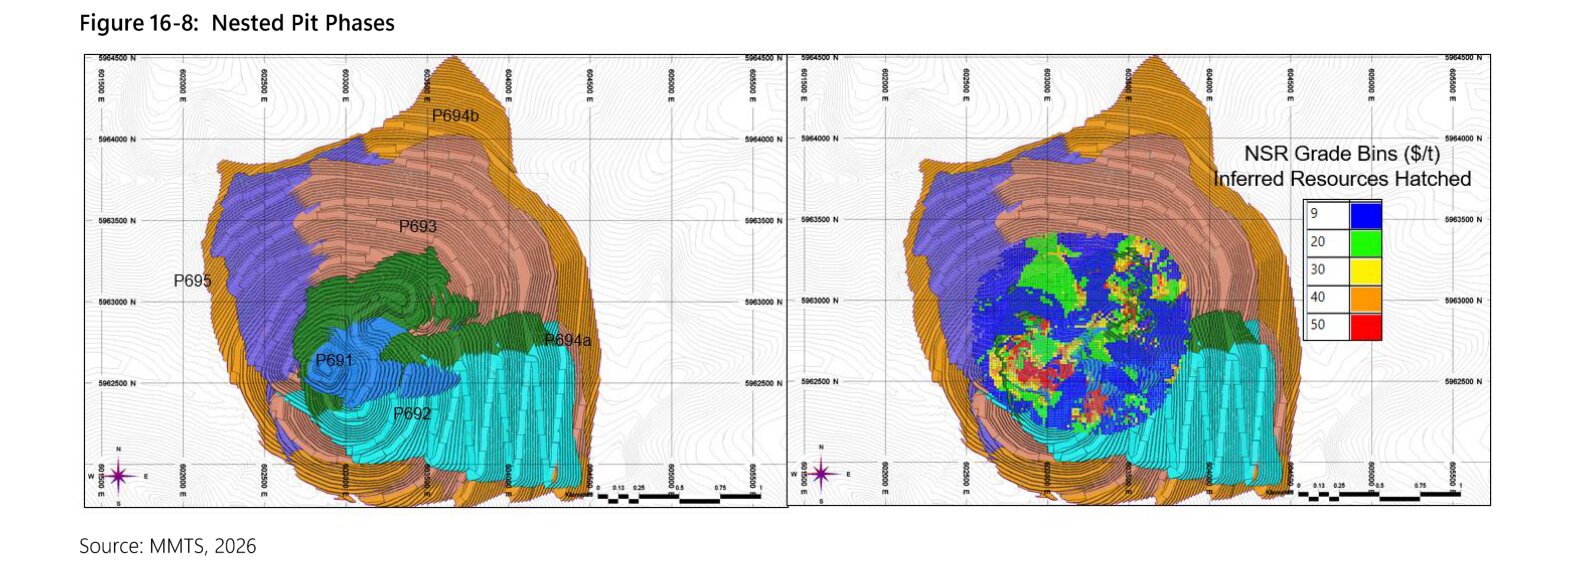
The PFS mines the pit in six phases. For each phase it states crest, floor, and ramp and safety berm elevations. These figures set each part's depth. Source: PFS, p. 211.
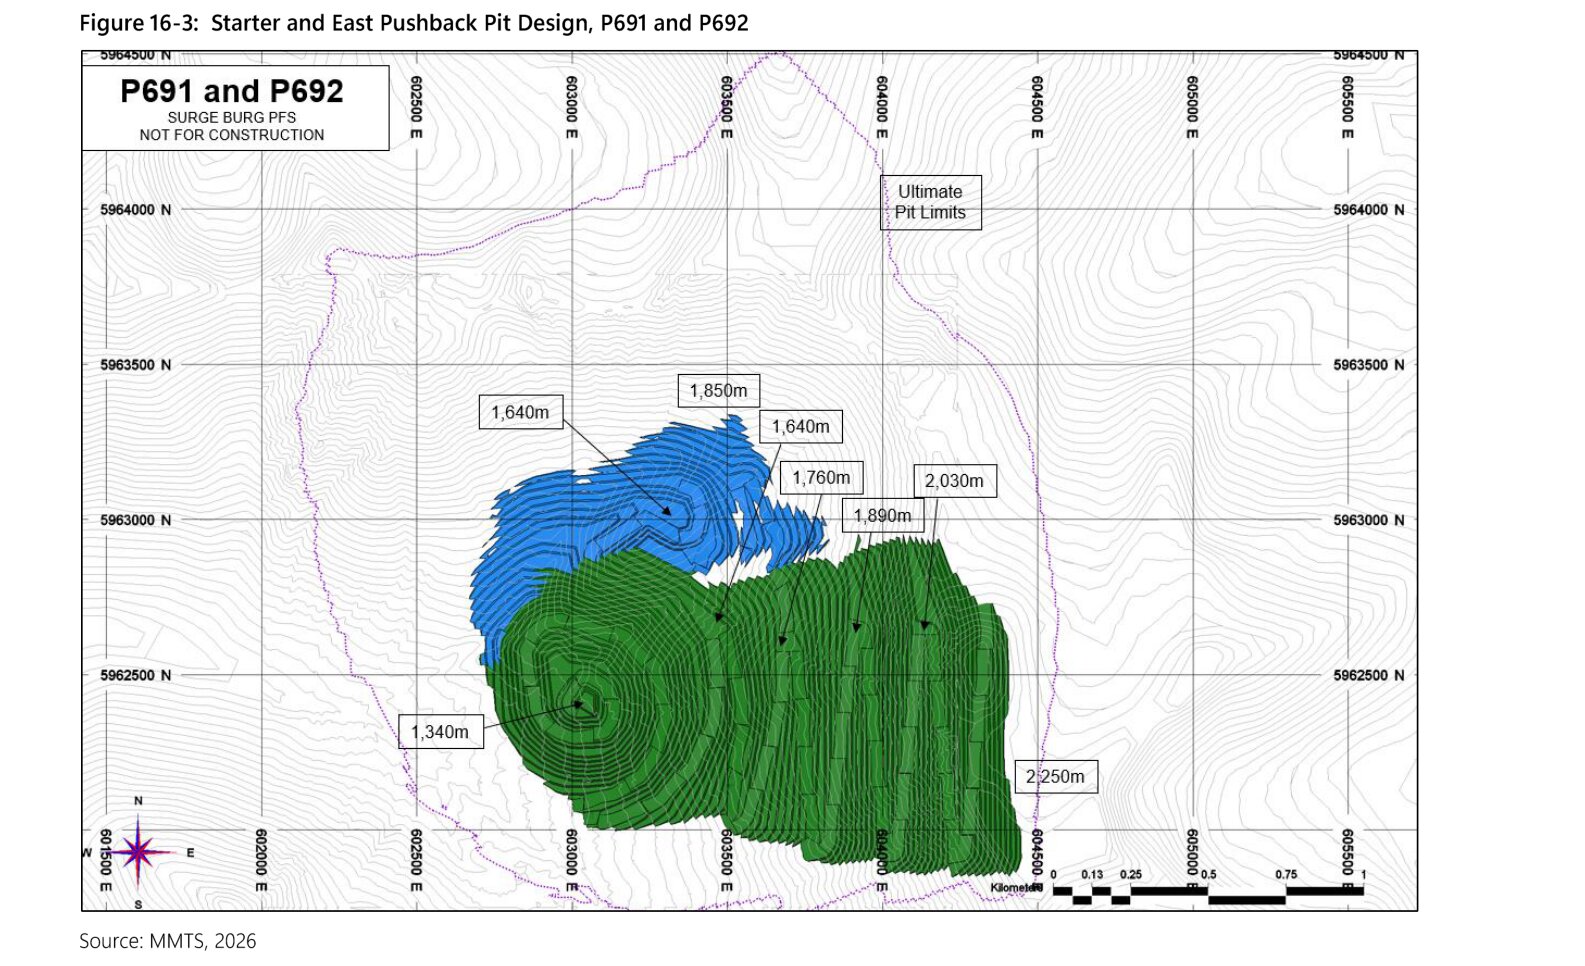
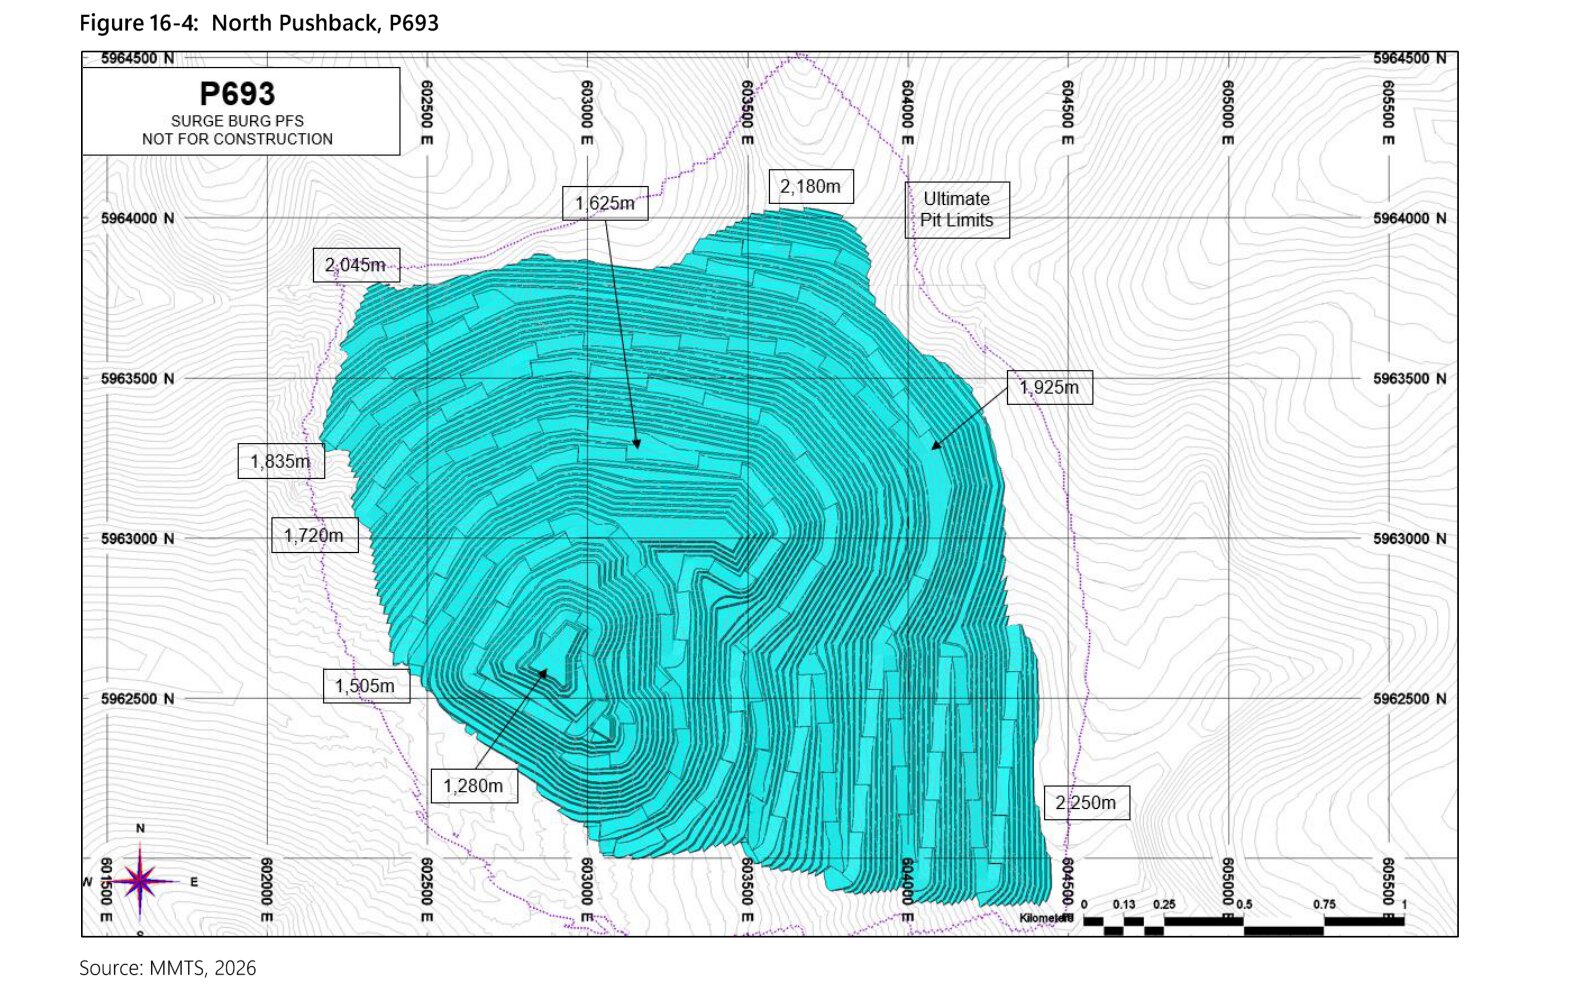
Each phase also has a plan drawing on its UTM grid, with benches drawn and floors and crests labelled by elevation. Laid on that grid, these drawings give each phase's shape between its stated elevations. Source: PFS, p. 212 to PFS, p. 217.
Sections through the pit
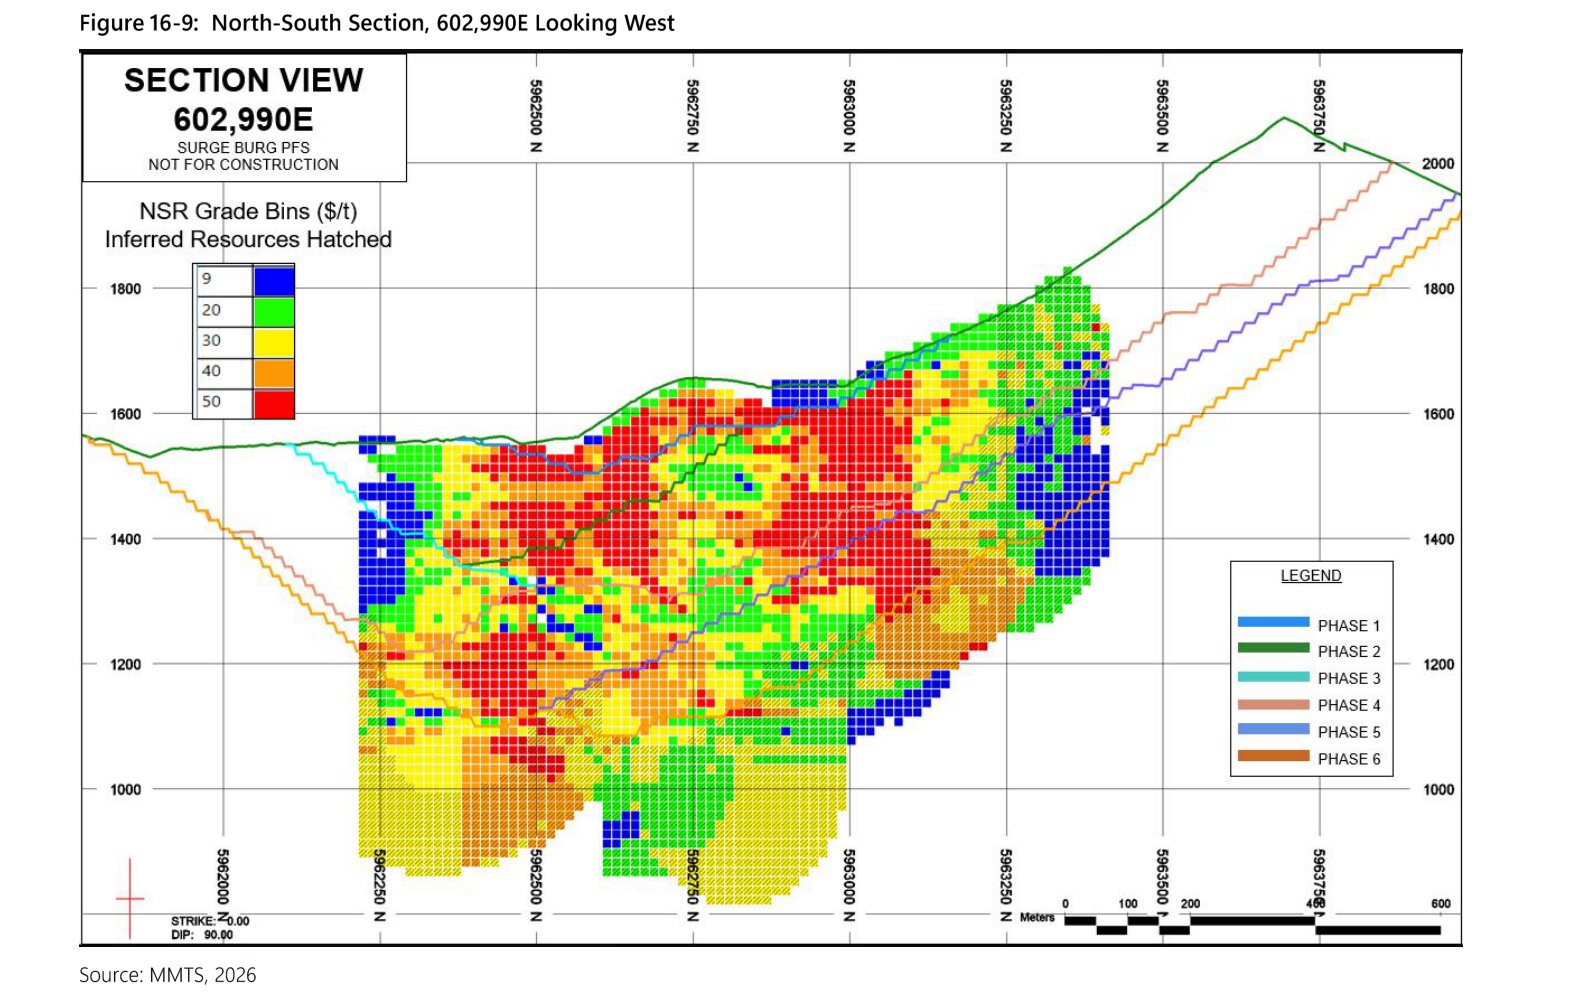
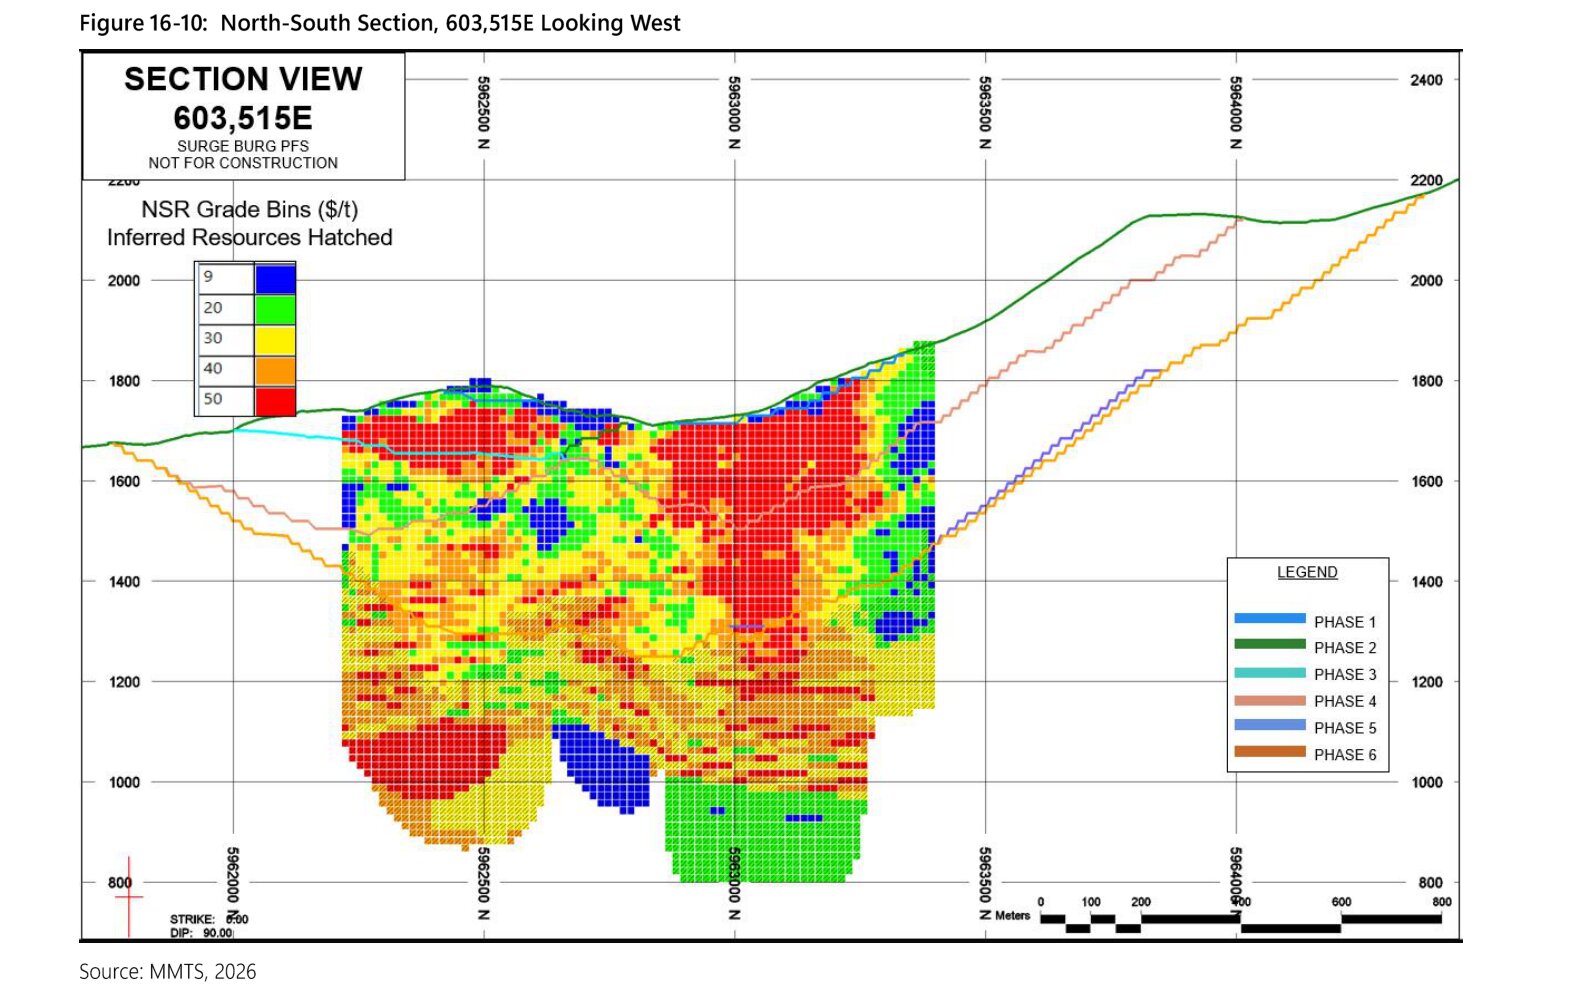
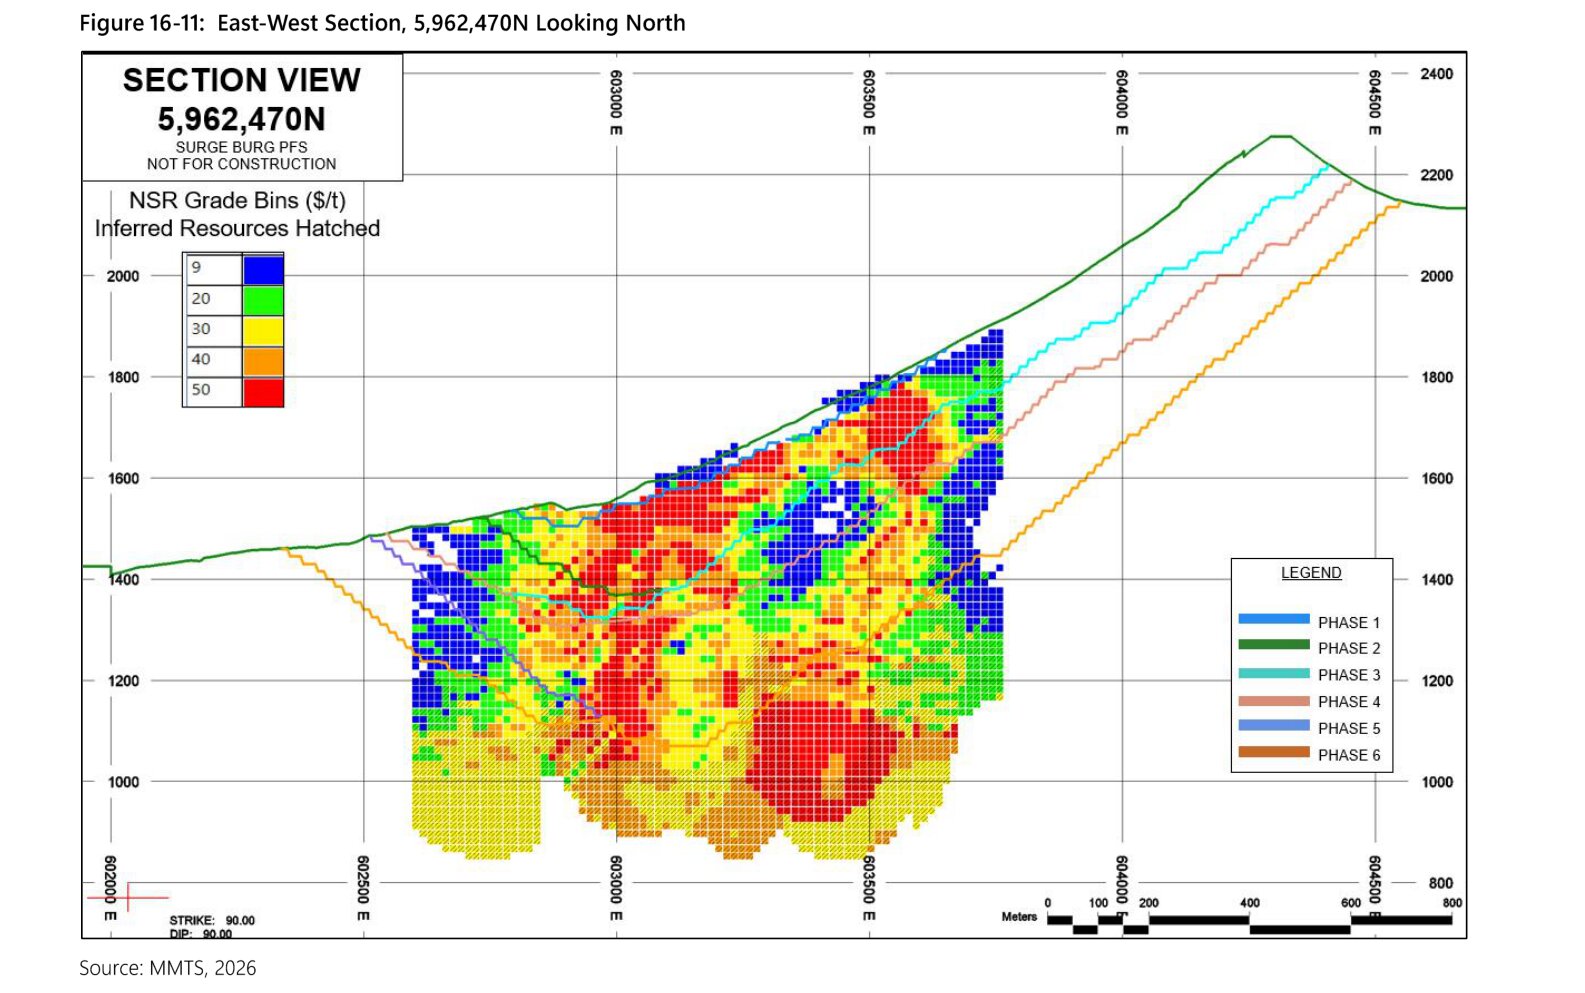
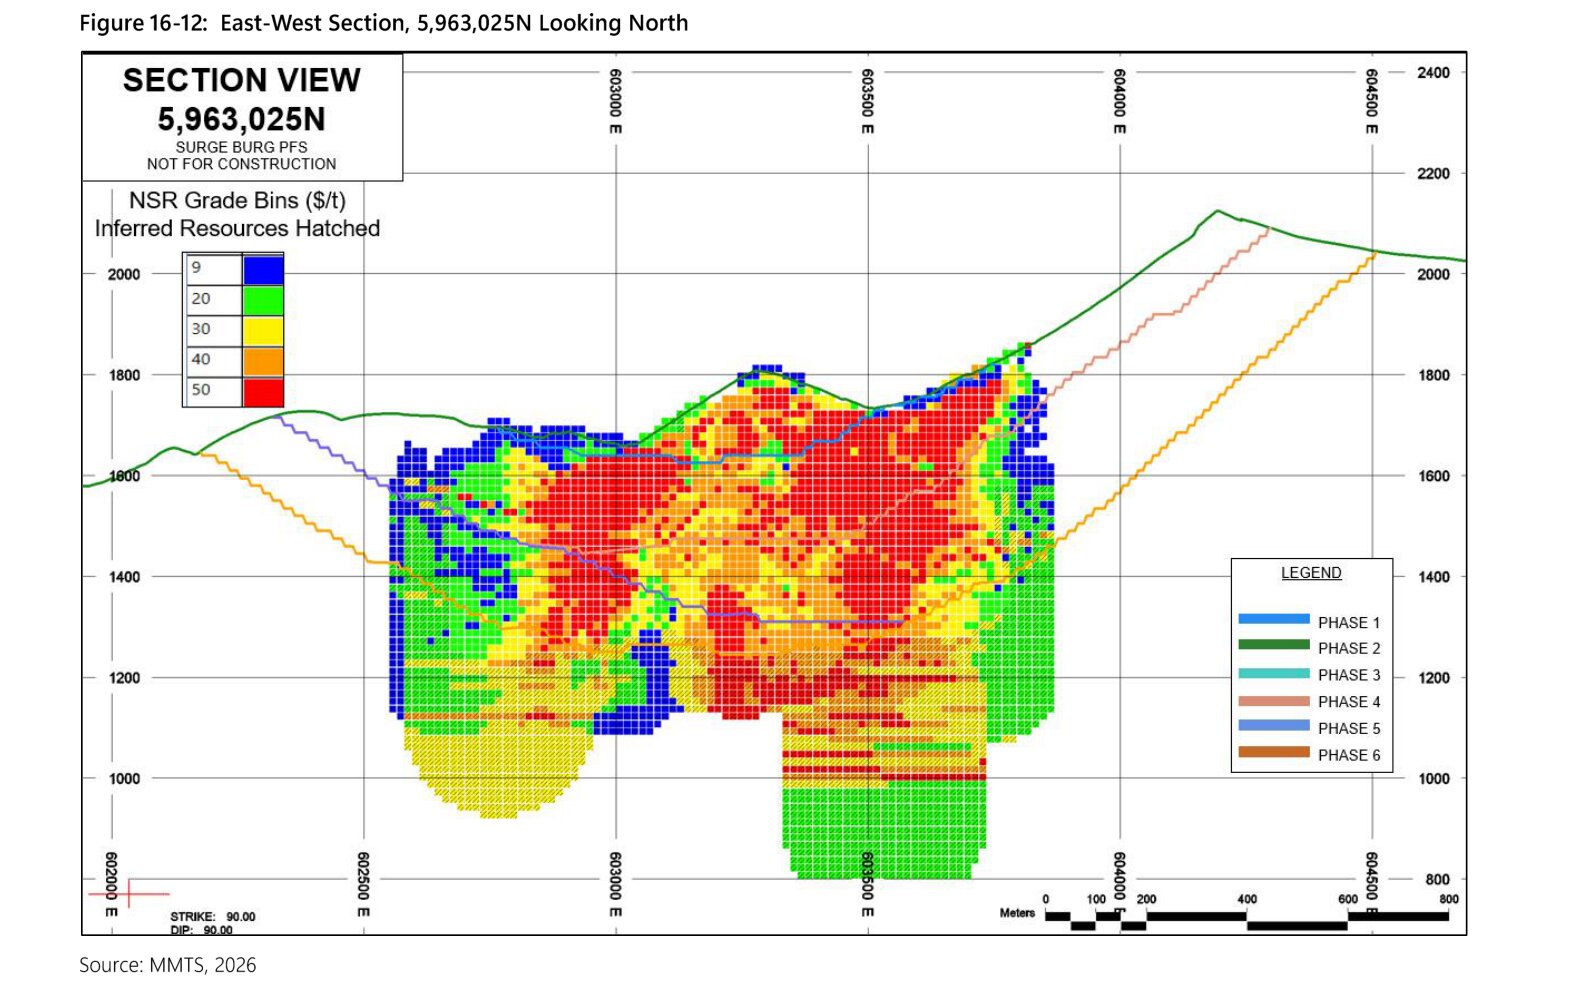
Four sections cut the pit along stated grid lines, two north to south and two east to west. They show pit walls and ground surface against elevation, and they check depths read from the plans. Source: PFS, p. 218 to PFS, p. 221.
Pit wall slopes
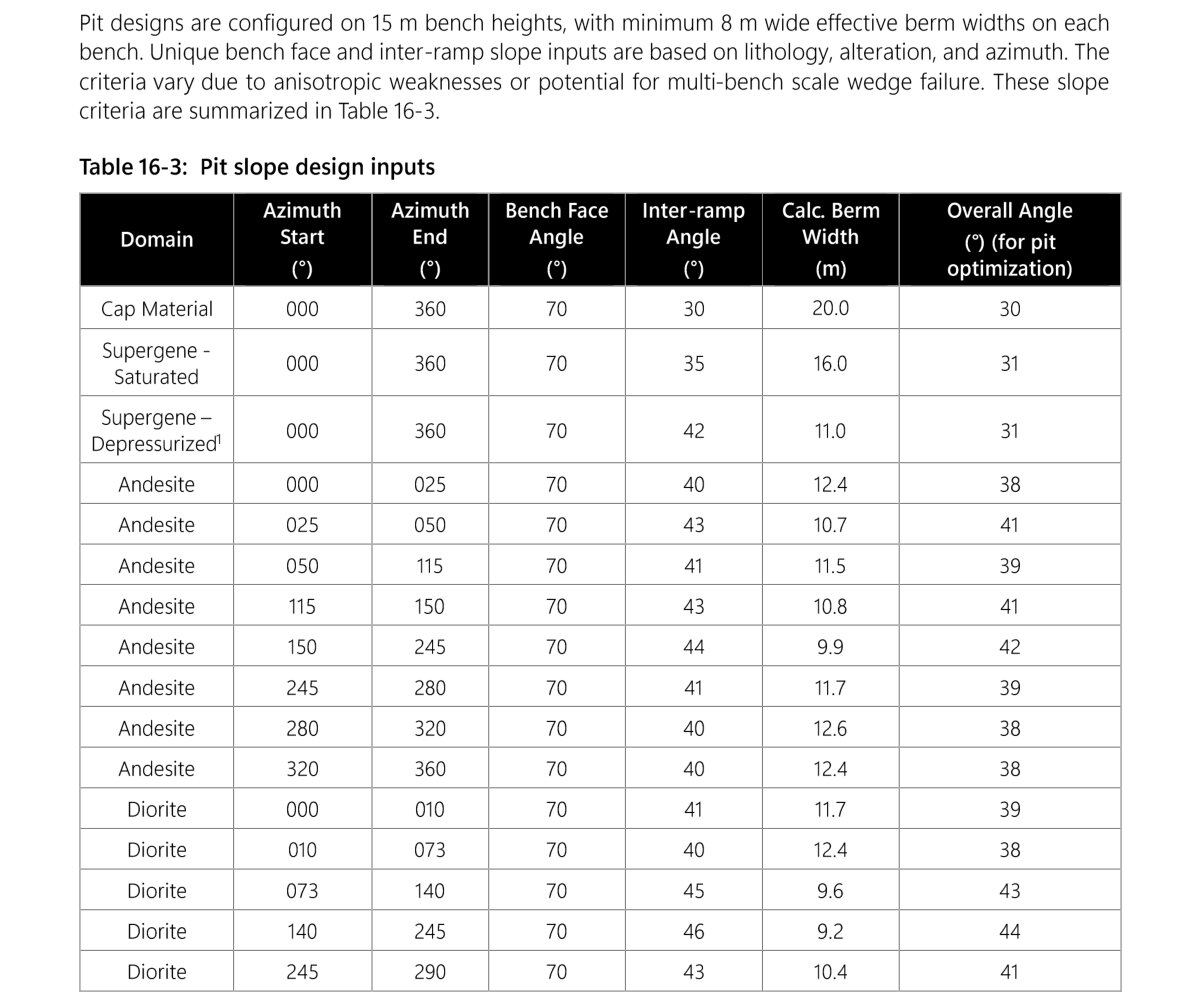
The pit is cut in 15-metre benches with berms at least 8 metres wide. Wall angles vary by rock type and by facing direction. Bench faces stand at 70 degrees, and overall walls run from 30 degrees in cap rock to 44 degrees in diorite. The model applies these angles between bench lines read from the plans. Source: PFS, p. 206, Table 16-3.
Waste rock dumps
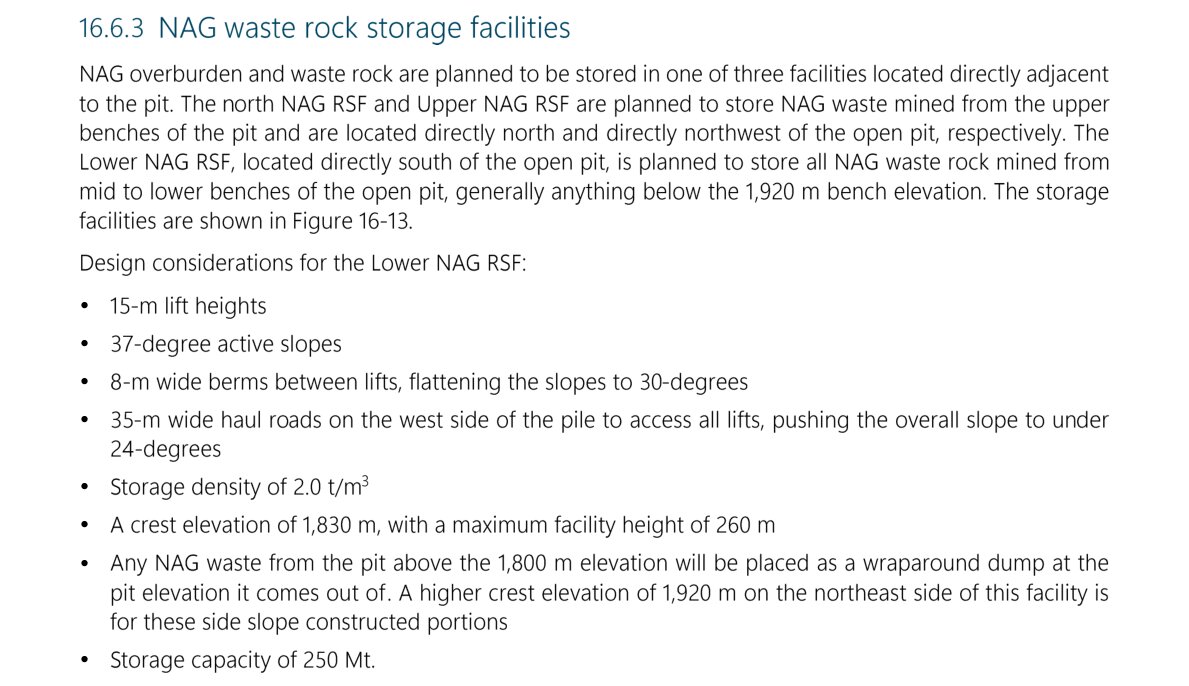
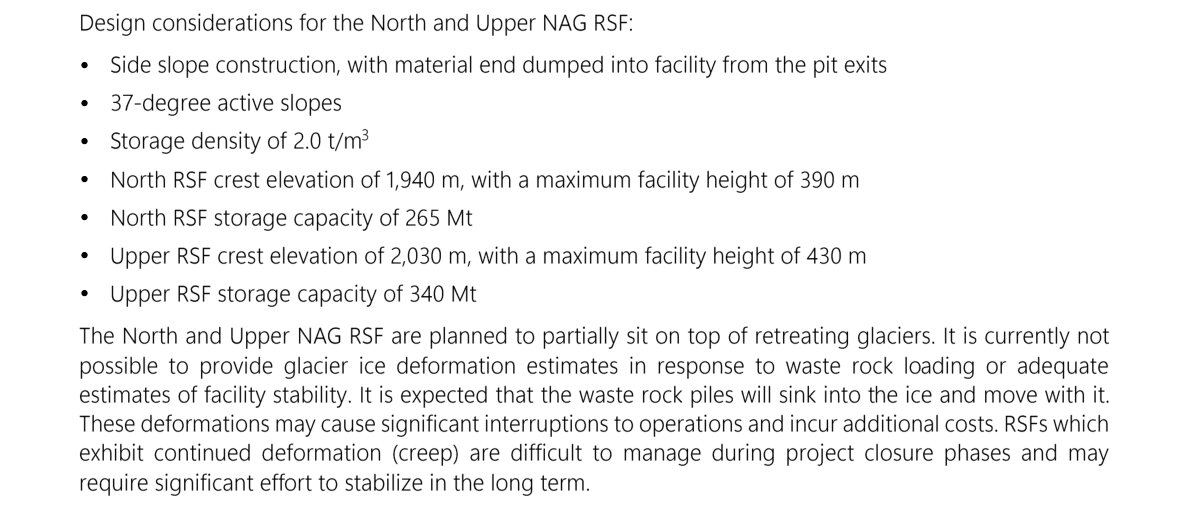
Rock that does not generate acid goes to three dumps beside the pit. The PFS gives each dump's crest elevation, maximum height, slopes and capacity. Lower dump rises to 1,830 metres, North dump to 1,940 metres and Upper dump to 2,030 metres. Surge Copper notes that North and Upper dumps partly sit on retreating glaciers. Source: PFS, p. 225; PFS, p. 226.
Pit and dumps together
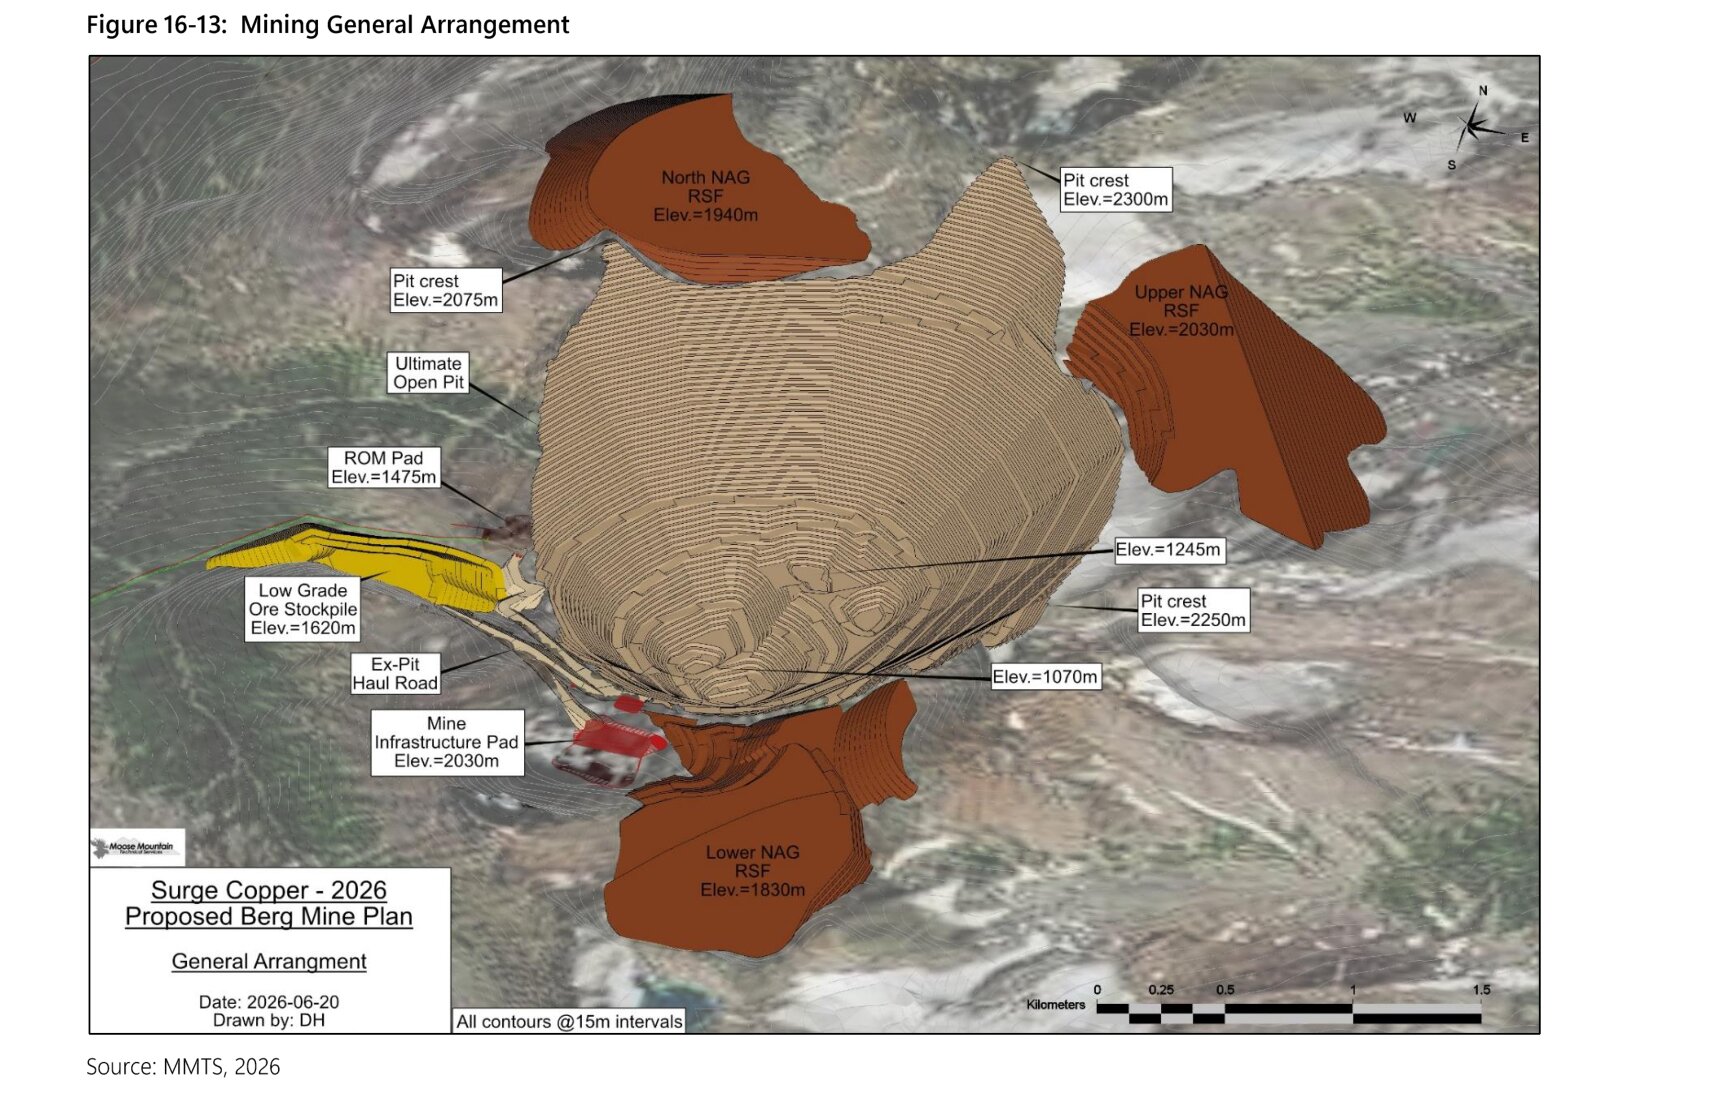
A general arrangement drawing shows the final pit and three dumps on an air photo, with 15-metre contours and elevations of each crest, pit floor, ore pad and stockpile. It checks the model as a whole. Source: PFS, p. 223, Figure 16-13.
Tailings facility
A site plan places the tailings facility in a valley beside Nanika Lake, held by a northeast embankment of waste rock and a southwest embankment of cyclone sand. Source: PFS, p. 257, Figure 18-1.
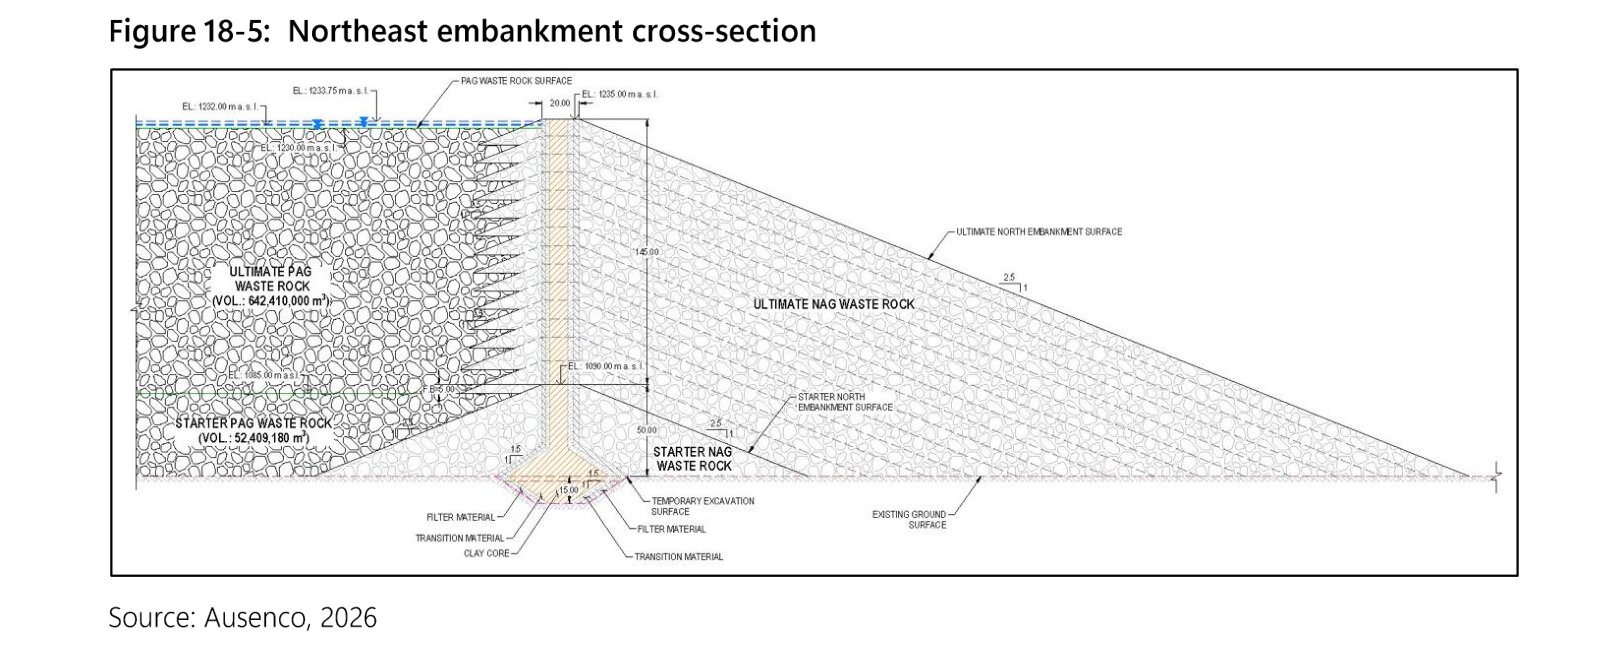
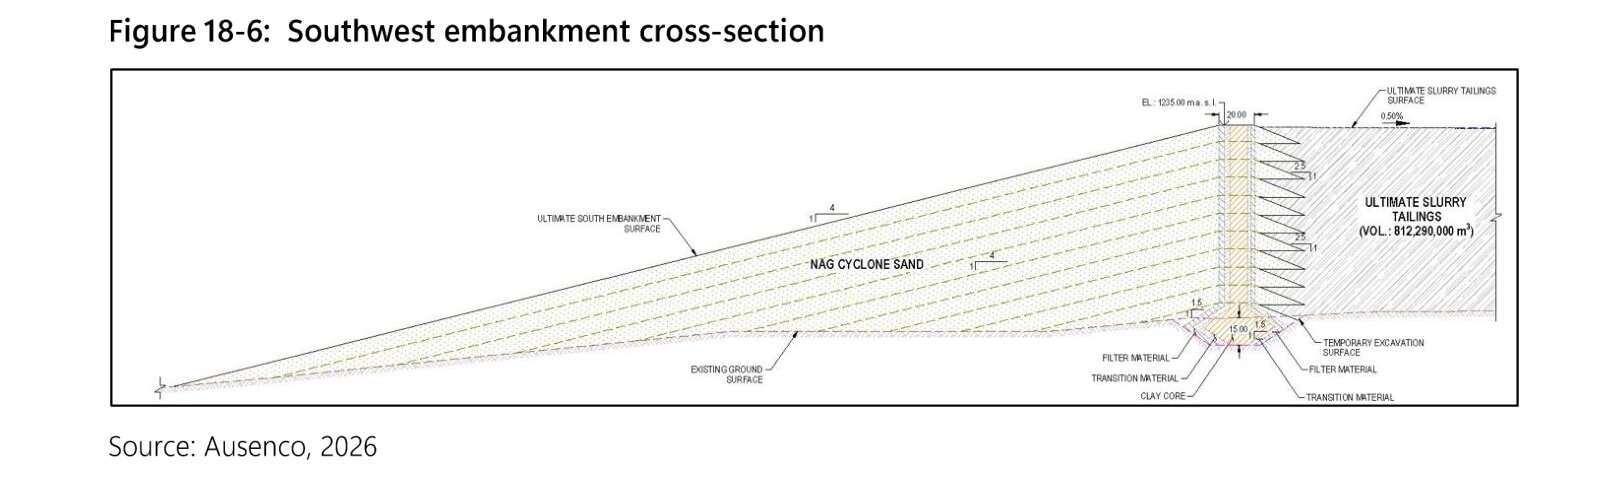
Two embankment sections give heights. Both embankments reach a crest at 1,235 metres. Northeast embankment rises 145 metres above a starter embankment 50 metres high, with a downstream slope of 2.5 horizontal to 1 vertical. Southwest embankment's downstream slope is 4 to 1. On its northeast side, water over acid-generating waste rock stands at 1,232 metres. Source: PFS, p. 265, Figures 18-5 and 18-6.
Read from the filings, and drawn between them
Some heights are printed in the filings. These are the pit floors, the dump crests, the embankment crests and the pond level. The model holds those heights exactly. The outlines are read from the vector drawing of the site layout. The faces between an outline and a printed height are not drawn in the filings as surfaces, so the model draws them at the slopes the filings state. The Source colouring marks every part one way or the other.